


Q2 2026 Market Commentary
After a Wobbly First Quarter, Markets Came Surging Back
We are writing this mid-year update as the United States of America reaches its 250th anniversary, a fitting moment to take stock of where things stand. Back in January, we wrote that we expected the U.S. economy to continue growing, AI to remain one of the market’s biggest drivers, and bonds to require a selective approach. Broadly speaking, those views still hold.
That said, getting here hasn’t been a smooth ride. The Iran conflict rattled energy markets, reignited inflation worries, and shifted expectations for Federal Reserve policy. Even though most of our core views have held up, the path has been far choppier than the headline numbers suggest.
Some things, however, have not changed. U.S. corporate earnings remain impressively resilient, and certain companies continue to grow at almost unprecedented rates. The AI infrastructure buildout we flagged as a defining theme of the decade has not slowed. If anything, it has accelerated, as evidenced by the most anticipated IPO pipeline in recent memory. As a result of all of these factors, the second quarter finished up as the strongest quarter for the S&P 500 in six years.1
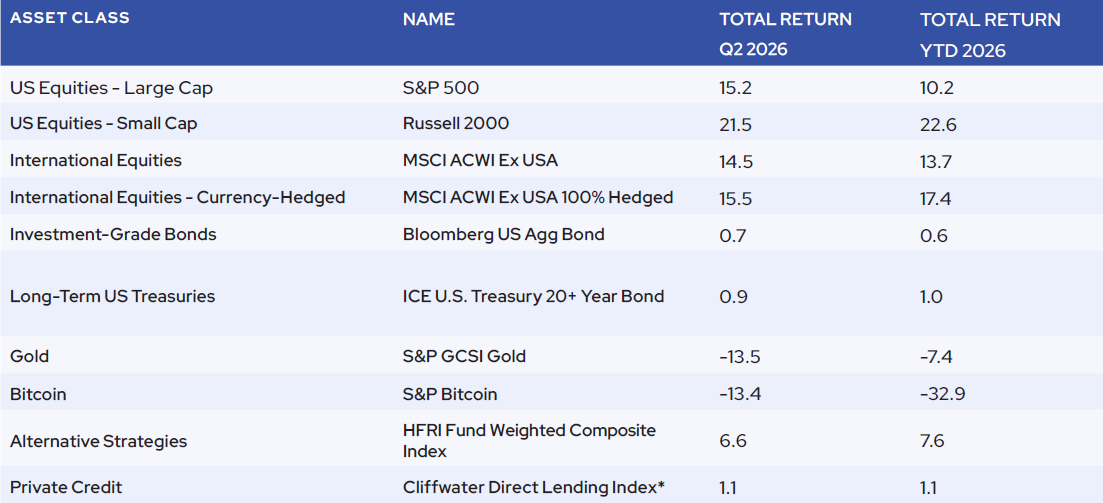
Source: Mornings tar, HFRI. Data as of July 8, 2026.
*Cliffwater returns reported through March.
There is no guarantee that any investment strategy, investment recommendations or decisions will achieve its objectives, generate profits or avoid losses. Past performance is not indicative of future results. The commentary may utilize index returns; however, you cannot invest directly into an index without incurring fees and expenses of investment in a security or other instrument. For Illustrative Purposes.
That mix of confirmation and surprise is a useful reminder of why we build portfolios to survive multiple potential outcomes. We are not trying to bet everything on a single forecast. Instead, we try to plan for a range of possibilities. In this update, we will walk through what we are watching, what has changed, and how that informs our thinking. We will also continue this conversation at our Wealth Summit on October 1st in La Jolla, where several of these themes will be explored in greater depth in the context of the 250th anniversary.
The AI Boom Still Has Room
When we laid out our 2026 outlook, we identified two core beliefs: that the U.S. economy would keep growing, and that the AI buildout would be a major driver of it. So far, both views have been supported. The U.S. economy grew at more than 2.0% year-over-year in Q1, and artificial intelligence serves as a key driver of that sustained growth.2
We like to think about the AI buildout in phases, which may overlap but are distinct. Phase one was the innovation: generative models and the interfaces that made them accessible to everyday users. Phase two is the infrastructure. Phase three is the diffusion across the economy. We are clearly in the thick of phase two. We believe that phase three is still in the early stages, but ramping up fast.
One thing that has surprised us about this current environment is the extent to which markets are still more focused on phase two and ignoring – or even penalizing – potential beneficiaries of phase three. This is illustrated by the astonishing divergence in performance between hardware and software companies. Over the trailing three years ending June 30, 2026, semiconductors (as represented by SMH) have outperformed software (as represented by IGV) by nearly 250% cumulatively.3 That divergence reflects a market aggressively rewarding the infrastructure layer while treating software and application-layer businesses as relative losers.4 The hyperscalers are also partly to blame, because these companies – Microsoft, Google, Meta, Amazon – are spending so aggressively on AI infrastructure that their own free cash flow is plummeting, even as that same capex floods into the income statements of the semiconductor and hardware companies supplying them.
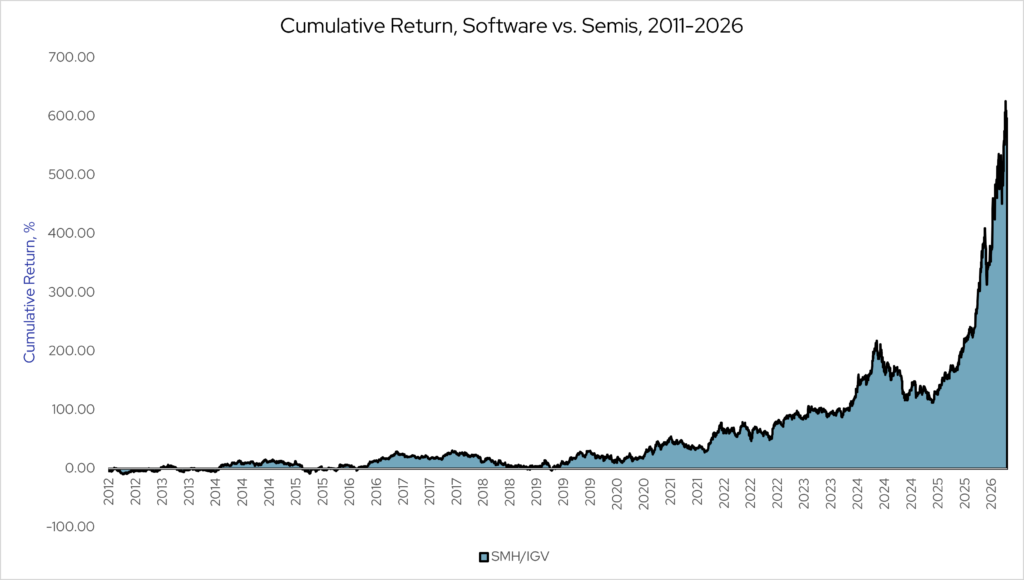
Source: Morningstar Direct. Chart represents the cumulative return of an illustrative long/short portfolio: 100% long SMH (VanEck Semiconductor ETF), 100% short IGV (iShares Expanded Tech-Software ETF), with short proceeds held in VTMXX (Vanguard Federal Money Market Fund). Portfolio rebalanced monthly. Data as of July 1, 2026.5
Results do not account for transaction costs or short borrow costs, which would reduce returns. Illustrative portfolios have inherent limitations and may not be achievable. Any issuers or securities mentioned are provided as illustrations for the limited purpose of analyzing general market and economic conditions and may not for the basis for an investment decision, nor are they intended to serve as investment advice. AlphaCore is not recommending the purchase, sale or holding of any security and is making no representation or indication of its own holdings of any securities. AlphaCore may in fact be currently recommending the purchase or sale of a security or regardless of any statement made in this document about that security or whether AlphaCore owns it or not.
The key question is not whether AI will continue to reshape markets. We believe it will. The more important question is how to invest in that shift without getting too far ahead of it. That is why we still believe broad public equity exposure matters. If we had tried to be too precise about who the next beneficiary of the AI trend would be, we could have missed some of the market’s biggest winners, including companies like Intel and Micron.
However, we don’t think that passive exposure alone is good enough. We believe that there is a rare opportunity unfolding in the enterprise software space. The market has broadly re-rated these businesses as secular losers, creating a valuation dislocation that we view as an attractive entry point. In private markets, we have partnered with specialist managers to deploy capital into companies we believe are positioned to become the next generation of value creators.
Across asset classes, we seek to manage our exposure by pairing AI-sensitivity with other characteristics that we believe provide some downside cushion. For instance, infrastructure assets tend to offer stable, contracted cash flows with built-in inflation linkage, which makes them a compelling way to participate in this theme while maintaining more defensive characteristics than other, more direct types of exposure. While AI remains one of the market’s most powerful long-term growth drivers, investor enthusiasm ultimately requires support from underlying business fundamentals.
Earnings Surprise to the Upside
In the public markets, corporate earnings continue to provide that support. Markets have given investors plenty of reasons to worry this year, but earnings upside surprises have been strong enough to keep these concerns in check. The S&P 500 is on track to report year-over-year earnings growth of 23.1% for Q2 – which would mark the second consecutive quarter above 20% and the seventh straight quarter of double-digit growth. What makes this cycle unusual is that estimates have actually moved higher during the quarter, rising 3.4% since March 31. In a typical quarter, estimates fall. Companies are not just meeting the bar; they are raising it.6
Beneath the surface, however, market leadership has evolved. The Mag 7 names that powered much of the market’s advance from 2023 through 2025 have broadly stalled, returning 0% cumulatively YTD.7
Other areas have stepped in to carry the baton. Energy companies benefited from higher oil prices following the conflict with Iran, helping Exxon and Chevron surpass expectations, while semiconductor leaders continued to benefit from resilient AI-related demand. TSMC, a company that fabricates the advanced processors that power AI models, recently raised its 2026 revenue growth outlook to more than 30%.8
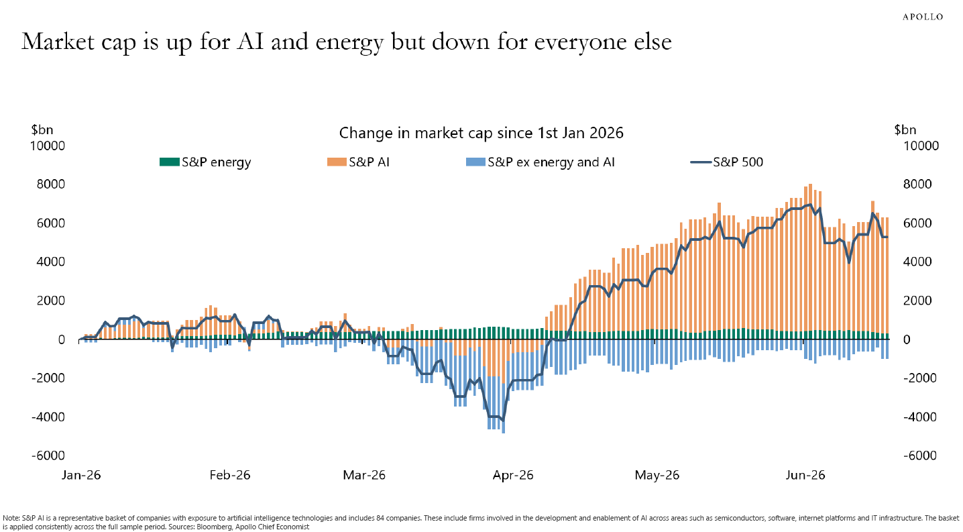
Source: Torsten Slok, Apollo, Bloomberg. S&P AI is a representative basket of companies with exposure to artificial intelligence technologies and includes 85 companies. These include firms involved in the development and enablement of AI across areas such as semiconductors, software, internet platforms and IT infrastructure. The basket is applied consistently across the full sample period. Data as of June 19, 2026. There is no guarantee that any investment strategy, investment recommendations or decisions will achieve its objectives, generate profits or avoid losses. Past performance is not indicative of future results. The commentary may utilize index returns; however, you cannot invest directly into an index without incurring fees and expenses of investment in a security or other instrument. For Illustrative Purposes.
Wall Street’s outlook for corporate profit growth remains favorable through the back half of this year and into 2027.
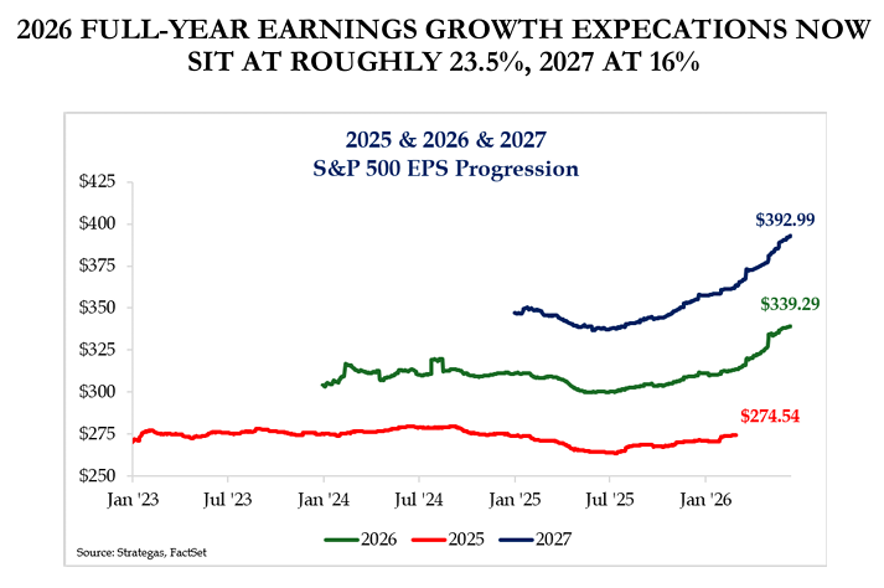
Source: Strategas, Todd Sohn, CMT. Data as of June 15, 2026.
There is no guarantee that any investment strategy, investment recommendations or decisions will achieve its objectives, generate profits or avoid losses. Past performance is not indicative of future results. The commentary may utilize index returns; however, you cannot invest directly into an index without incurring fees and expenses of investment in a security or other instrument. For Illustrative Purposes.
International performance was also strong. Emerging markets have been among the strongest-performing regions this year, driven largely by AI just like the U.S. Specifically, EM performance reflects concentrated semiconductor exposure. TSMC, SK Hynix, and Samsung now account for roughly 28% of the MSCI Emerging Markets Index and have been central to its outperformance.9 Developed international markets have also held up well, demonstrating that equity leadership is becoming more diversified across both sectors and geographies.
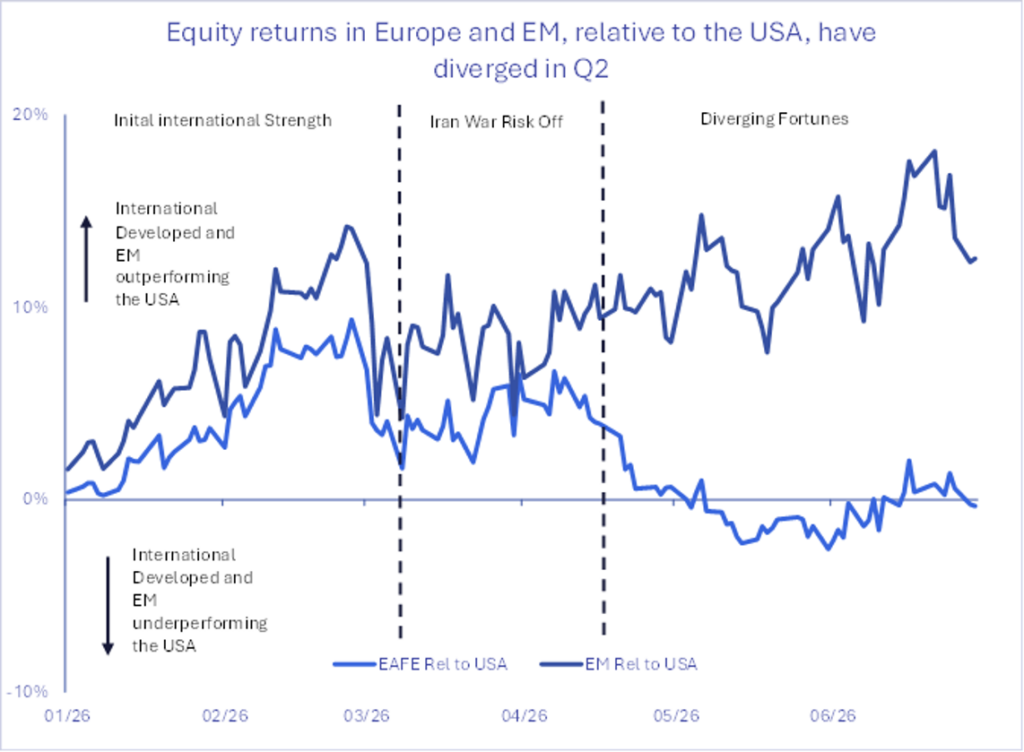
Source: Factset. Data as of July 1, 2026. “USA” is represented by S&P 500 Index. “EAFE” is the Developed World ex. USA represented by MSCI EAFE Index. “EM” is Emerging Markets represented by MSCI EM Index. For Illustrative Purposes.
When reflecting on what the past six months may mean going forward, the recent conflict with Iran served as a reminder that energy markets remain a critical source of both geopolitical risk and investment opportunity. Today, energy security extends beyond simply securing cheap oil – it increasingly involves diversifying an entire nation’s energy mix across traditional fuels, renewables, and emerging technologies. We believe natural resources can provide investors with exposure to these themes while also benefiting from the physical commodity demand required to support the global AI infrastructure buildout.
IPO Launches Fuel Fresh Exuberence
Investor sentiment has improved alongside the earnings outlook. One of the clearest signs is the IPO market, which has raised $730B so far in 2026 – the second-best start to a year on record.10 After several muted years, the summer opened with one of the most anticipated public market debuts of all time: the listing of SpaceX. To put the magnitude in context: the roughly $82 billion in shares floated represented approximately 2x the daily trading volume of SPY, the most actively traded security on U.S. exchanges, and 3.5x the float of Meta’s IPO at its debut.11
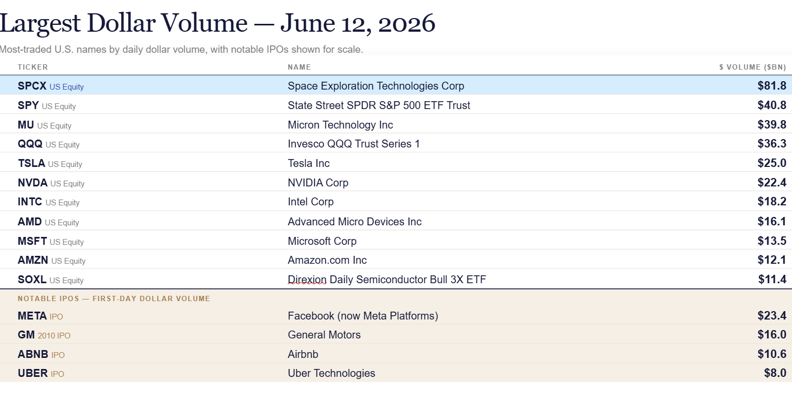
Source: Todd Sohn, CMT, Strategas. Data, as of June 12 2026.
Source: Factset. Data as of July 1, 2026. “USA” is represented by S&P 500 Index. “EAFE” is the Developed World ex. USA represented by MSCI EAFE Index. “EM” is Emerging Markets represented by
MSCI EM Index. For Illustrative Purposes.
We have heard a lot of questions about whether investors should participate in these large IPOs and try to capture the first-day pop. We expect we will get more of these questions, especially with other AI-related companies potentially coming to market later this year, including Anthropic (October listing targeted, current post-money valuation ~$965B) and OpenAI (initial September listing targeted, possibly delayed, current post-money valuation ~$852B).12
The short-term pop-chasing that follows these highflyers overlooks the long view, in our opinion. SpaceX illustrates how many of today’s largest private companies are reaching the public markets only after much of their growth story has already played out in private hands.
This type of exposure is worth having in small doses but is also freighted with downside risks. That is why we think it’s critical to remain diversified across both public and private markets where suitable. Qualifying investors that don’t have a private markets allocation fail to get exposure to the compounding of private companies that, 20 years ago, might have been public.
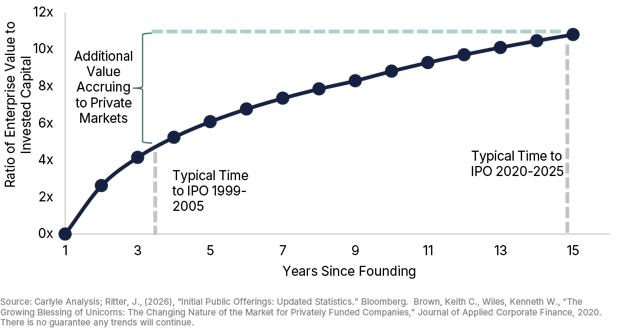
Source: Carlyle. “Space Commonality.” For illustrative purposes only. Data as of June 16, 2026. For Illustrative Purposes.
Iran War Throws a Wrench, But Not Where You’d Expect
The biggest wild card of the first half was the Iran conflict, in particular how it impacted markets. While the stock market was largely able to shake off its impacts, the bond markets moved more substantially. That’s because of the influence of energy price spikes on inflation. Even though the White House has since announced a formal end to the conflict, near-term physical supply shortages are likely to overlap with peak summer demand, and markets have already repriced to account for that reality. As a result, markets now expect the next move from new Fed Chair Kevin Warsh to be a hike, not a cut.
The headline inflation picture is uncomfortable, but we think the worst may be behind us. Oil prices have fallen 39.7% from their April peak of $113 per barrel, tariff pressure has eased, and the housing market looks more contained – the rental vacancy rate sits at 7.3%, an eight-year high, suggesting rental growth will be modest at best.13, 14 Taken together, these factors make a compelling case that headline PCE inflation is closer to its peak than its trough. Core inflation, which strips out food and energy, tells a different story: services prices have proven stickier, and several Fed governors have flagged this as their primary concern. Time will tell what measure Warsh decides to emphasize and whether that influences his decision to hike before year-end.
That said, no matter what the Fed does, we don’t expect the world to return to the pre-COVID norms of lower inflation and rates. We expect inflation to stay higher and more uneven, which means central banks around the world may continue moving at different speeds depending on conditions in their own economies. The old playbook that worked in the old regime – stocks fall, bonds rise, risk managed – is no longer quite so reliable.
That is precisely why our approach is different. Rather than depending on bonds to cushion equity drawdowns, we use alternatives as portfolio ballast, which frees our fixed income managers to go on offense. We also hold hedged exposure to global rate and credit dispersion through an unconstrained global bond fund, giving us the ability to capitalize on the divergence across central banks without taking on uncompensated commodity and currency risks. In a world where rate risk can cut both ways, we think that flexibility is critical.
If any of our directional exposures in equities, fixed income, or real assets does not perform as we expect, we also hold exposure to multi-strategy alternatives funds to provide stability. And as we noted above, that stability is not just defensive. By dampening overall portfolio volatility, alternatives give our fixed income managers the freedom to pursue more active, return-seeking positioning.
In Conclusion
The first half of 2026 tested investors in ways that few anticipated. A military conflict in the Middle East, an inflation scare, a reshuffled Fed, and one of the most extraordinary IPO moments in market history – all compressed into six months. And yet, portfolios built on diversification and discipline held up. That is not an accident. It is the result of building for outcomes we cannot predict, rather than positioning for the single scenario we hope for.
The second half brings its own set of questions. Will inflation continue to recede, or will energy markets deliver another surprise? Will the midterms shift the policy backdrop in ways that matter for markets? Will the next wave of AI mega-IPOs live up to the hype, or will investors grow more discerning? We do not claim to know the answers. What we do know is that the themes driving markets – AI, energy security, the shift in how companies access capital, and the pressure on central banks worldwide – are durable. They do not resolve in a single quarter.
We look forward to going deeper on all of these topics at our annual Wealth Summit on October 1st in La Jolla. In the meantime, please do not hesitate to reach out to your advisor with questions.
[1] Source: Hur, Krystal. “Wall Street’s Best Quarter in Six Years Will Be a Hard Act to Follow.” Wall Street Journal. June 30, 2026.
[2] Source: U.S. Bureau of Economic Analysis, “Gross Domestic Product,” Q1 2026, released June 26, 2026.
[3] Source: Morningstar Direct. Outperformance represents the cumulative three-year return of a hypothetical long/short portfolio: 100% long SMH (VanEck Semiconductor ETF), 100% short IGV (iShares Expanded Tech-Software ETF), with short proceeds held in VTMXX (Vanguard Federal Money Market Fund). Rebalanced on a quarterly basis. Data as of July 1, 2026.
[4] Source: Morningstar. “Winners and Losers Among Stock Funds During Q2 2026.” Data as of July 2, 2026.
[5] Source: Morningstar Direct. Chart represents the cumulative return of a hypothetical long/short portfolio: 100% long SMH (VanEck Semiconductor ETF), 100% short IGV (iShares Expanded Tech-Software ETF), with short proceeds held in VTMXX (Vanguard Federal Money Market Fund). Portfolio rebalanced monthly. Data as of July 1, 2026.
[6] Source: Factset, “Earnings Insight.” June 26, 2026.
[7] Source: FactSet, Standard & Poor’s, J.P. Morgan Asset Management. “Guide to the Markets – U.S.” Data are as of June 30, 2026.
[8] Source: Taiwan Semiconductor Manufacturing Company, “First Quarter 2026 Earnings Conference Call Transcript.” April 16, 2026. This security is referenced for the limited purpose of analyzing general market or economic conditions and should not serve as the basis for an investment decision, nor is it intended to serve as investment advice.
[9] Source: Strategas and Factset, Todd Sohn, CMT, as of June 15th, 2026.
[10] Source: Stonor, Joe. “Equity-Market Fundraising at Most Exuberant Since 2021, Mergermarket Says.” Wall Street Journal. July 1, 2026.
[11] Source: Todd Sohn, CMT, Strategas, as of June, 12, 2026
[12] Source: “Anthropic’s valuation surges to $965 billion, surpassing OpenAI.” Reuters, May 28, 2026.
[13] Source: Koyfin. Data as of July 1, 2026.
[14] U.S. Census Bureau. “Rental Vacancy Rate in the United States.” Retrieved from FRED, Federal Reserve Bank of St. Louis. Data as of July 1, 2026.
Disclosure
This material is being provided for informational purposes only. This material represents the current views and opinions of AlphaCore Capital, and there is no guarantee that any opinions will prove to be accurate, or any forecasts made will come to pass. No obligation is undertaken to update any information, data or material contained herein. AlphaCore provides investment advice only within the context of our written advisory agreement with each AlphaCore client. It may contain forward-looking statements regarding economic trends, market developments, or other factors. Actual results could differ materially from those expressed or implied. AlphaCore is not recommending the purchase, sale or holding of any security. Information provided does not constitute an offer or solicitation, and should not be considered tax, legal, or accounting advice.
There is no guarantee that any investment strategy, investment recommendations or decisions will achieve its objectives, generate profits or avoid losses. Past performance is not indicative of future results. Certain data, charts, or information contained herein are sourced from third parties and are believed to be reliable; however, we do not guarantee their accuracy or completeness. Investors should consider their own circumstances and consult a professional advisor before making investment decisions. All investments are subject to a degree of risk. Risks can include, but are not limited to, increased market volatility, reduced liquidity, or loss of value, including initial invested capital. Alternative investments and strategies are subject to a set of unique risks Gold and other precious metals may be referred to as a “safe haven” investment or generally presented as a safety asset. These references should not be construed to ensure or guarantee any form of investment safety. Any specific security or strategy is subject to a unique due diligence process, and not all diligence is executed in the same manner. No level of due diligence mitigates all risks, and does not guarantee the elimination of market risk, failure, default, or fraud.
Before embarking on any investment program, you should carefully consider the risks and suitability of a strategy based on your own investment objectives and financial position.
.
Index Descriptions
Index and benchmark information is provided for general market comparison purposes only. Indices are unmanaged and cannot be invested in directly. Any investment in a strategy or investment vehicle designed to track an index would be subject to fees and expenses (and may incur transaction costs and taxes), which are not reflected in index returns.
MAGNIFICENT 7 (“Mag 7”) includes AAPL, AMZN, GOOGL/GOOG, META, MSFT, NVDA and TSLA. The S&P 500 ex-Mag 7 (S&P 493) is calculated by backing out a weighted average Mag 7 price return from the S&P 500 price return. *Return share represents the Mag 7’s contribution to the index return. Past performance is no guarantee of future results.
SMH/IGV: represents the cumulative three-year return of a hypothetical long/short portfolio: 100% long SMH (VanEck Semiconductor ETF), 100% short IGV (iShares Expanded Tech-Software ETF), with short proceeds held in VTMXX (Vanguard Federal Money Market Fund). Rebalanced on a quarterly basis.
S&P 500 INDEX: S&P 500 index is a float-adjusted market-cap weighted index, largely reflecting the large-cap U.S. equities. The index includes 500 leading companies and captures approximately 80% coverage of available market capitalization.
RUSSELL 2000 INDEX: A comprehensive view of small-cap performance, the Russell 2000 measures the performance of approximately 2,000 small-cap US equities.
MSCI AWCI EX USA INDEX: The MSCI ACWI ex USA Index captures large and mid-cap representation across 22 of 23 Developed Markets (DM) countries (excluding the US) and 24 Emerging Markets (EM) countries*. With 2,156 constituents, the index covers approximately 85% of the global equity opportunity set outside the US.
BLOOMBERG U.S. AGGREGATE BOND INDEX: The index consists of approximately 17,000 bonds. The index represents a wide range of securities, from investment grade and public to fixed income.
ICE U.S. TREASURY 20+ YEAR BOND INDEX: ICE U.S. Treasury 20+ Year Bond Index tracks the performance of US dollar denominated sovereign debt publicly issued by the US government in its domestic market. Qualifying securities must have greater than or equal to twenty years remaining term to final maturity as of the rebalancing date, a fixed coupon schedule and an adjusted amount outstanding of at least $300 million. The amount outstanding for all qualifying securities is adjusted to reduce by the amounts held by the Federal Reserve’s SOMA account. Bills, inflation-linked debt, original issue zero coupon securities and STRIPs are excluded from the Index; however, the amounts outstanding of qualifying coupon securities are not reduced by any portions that have been stripped. Agency debt with or without a US Government guarantee and securities issued or marketed primarily to retail investors do not qualify for inclusion in the index.
S&P GLOBAL NATURAL RESOURCES INDEX: The index includes 90 of the largest publicly-traded companies in natural resources and commodities businesses that meet specific investability requirements, offering investors diversified and investable equity exposure across 3 primary commodity-related sectors: agribusiness, energy, and metals & mining.
S&P GSCI GOLD INDEX: The S&P GSCI Gold Index, a sub-index of the S&P GSCI, provides investors with a reliable and publicly available benchmark tracking the COMEX gold future. The index is designed to be tradable, readily accessible to market participants, and cost efficient to implement.
HFRI FUND WEIGHTED COMPOSITE INDEX: The HFRI Fund Weighted Composite Index is a global, equal-weighted index of single-manager funds that report to HFR Database. Constituent funds report monthly net of all fees performance in U.S. Dollar and have a minimum of $50 Million under management or a twelve (12) month track record of active performance. The HFRI Fund Weighted Composite Index does not include Funds of Hedge Funds.
U.S. DOLLAR INDEX: The U.S. Dollar Index (USDX, DXY, DX, or, informally, the “Dixie”) is an index (or measure) of the value of the United States dollar relative to a basket of foreign currencies, often referred to as a basket of U.S. trade partners’ currencies. The Index goes up when the U.S. dollar gains “strength” (value) when compared to other currencies.
S&P BITCOIN INDEX: The S&P Bitcoin Index is designed to track the performance of the digital asset Bitcoin.
The S&P Bitcoin Index is designed to track the performance of the digital asset Bitcoin.
CLIFFWATER DIRECT LENDING INDEX (“CDLI”): The Cliffwater Direct Lending Index (“CDLI”) seeks to measure the unlevered, gross of fees performance of U.S. middle market corporate loans, as represented by the underlying assets of Business Development Companies (“BDCs”), including both exchange-traded and unlisted BDCs, subject to certain eligibility criteria. The CDLI is asset-weighted and calculated quarterly using financial statements and other information contained in the U.S. Securities and Exchange Commission (“SEC”) filings of all eligible BDCs. The loans captured by the CDLI represent a large share of the direct lending universe and, importantly, represent loans that are originated and held to maximize risk-adjusted return to shareholders and investors.
MSCI ACWI EX-USA 100% HEDGED USD: The MSCI ACWI ex USA US Dollar Hedged Index represents a close estimation of the performance that can be achieved by hedging the currency exposures of its parent index, the MSCI ACWI ex USA Index, to the USD, the “home” currency for the hedged index. The index is 100% hedged to the USD by selling each foreign currency forward at the one-month Forward rate. The parent index is composed of large and mid cap stocks across 22 Developed Markets (DM) countries and 24 Emerging Markets (EM) countries.
The S&P Bitcoin Index is designed to track the performance of the digital asset Bitcoin.
MSCI EAFE INDEX: The MSCI EAFE Index is an equity index which captures large and mid cap representation across Developed Markets countries around the world, excluding the US and Canada. The index covers approximately 85% of the free float-adjusted market capitalization in each country.
MSCI EM INDEX: The MSCI Emerging Markets Index captures large and mid cap representation across 24 Emerging Markets (EM) countries*. With 1,178 constituents, the index covers approximately 85% of the free float-adjusted market capitalization in each country.
Commentary Contributors
Eric Gerster, CFA®
Chief Investment Strategist
Johann Lee, CFA®
Director of Research
Dr. David Stubbs
Chief Investment Strategist
Madeline Hume, CFA®
Senior Research Analyst