Q3 2025 Market Commentary: A Tale of Two Cities
It Was the Best of Times; It Was the Worst of Times.
If Charles Dickens had been writing about markets instead of the French Revolution, he might have penned those words about 2025 instead of 1792. The third quarter was a study in contrasts: an almost surreal mix of exuberance and anxiety that left investors celebrating but also scratching their heads.
Source: Morningstar, HFRI. Data as of October 13, 2025.
Past performance is not indicative of future results. The commentary may utilize index returns; however, you cannot invest directly into an index without incurring fees a expenses of investment in a security or other instrument.
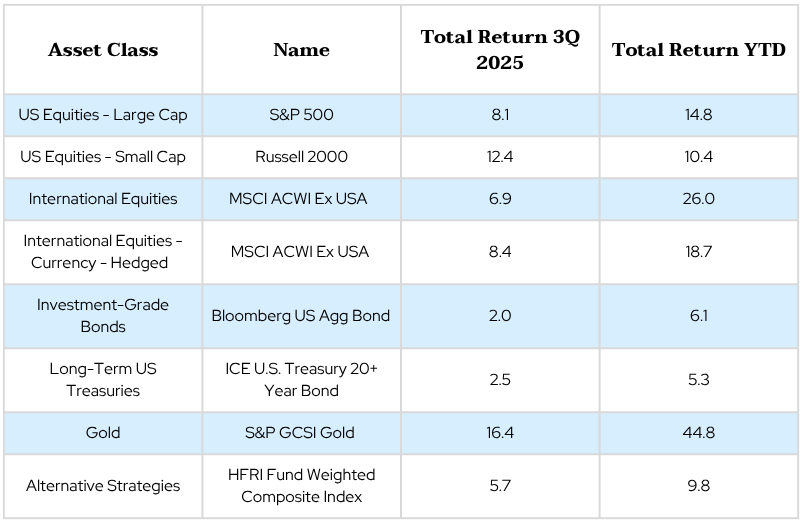
- Stock market hit new highs: The S&P 500 extended its tremendous tear during the third quarter, notching 23 all-time highs on its way to returning 8.1% QTD.[1] If the market keeps up its current pace, 2025 could mark the third consecutive year of double-digit returns. That’s happened only once in the last century, at the height of the dot-com boom.[2]
- Key economic indicators softened: The economic backdrop, however, has been telling a very different story.A substantial revision to the jobs report in July rattled investor confidence in the labor market, and subsequent reports have offered little reassurance. Core PCE inflation, meanwhile, has plateaued around 2.9%.[3] That is somewhat encouraging, in the sense that tariffs may take more time to flow through into the data than people initially expected. But it’s also an indication that there may be a higher resting heart rate for inflation going forward. It’s worth remembering that the Fed’s overall mandate is price stability, not necessarily 2% inflation.
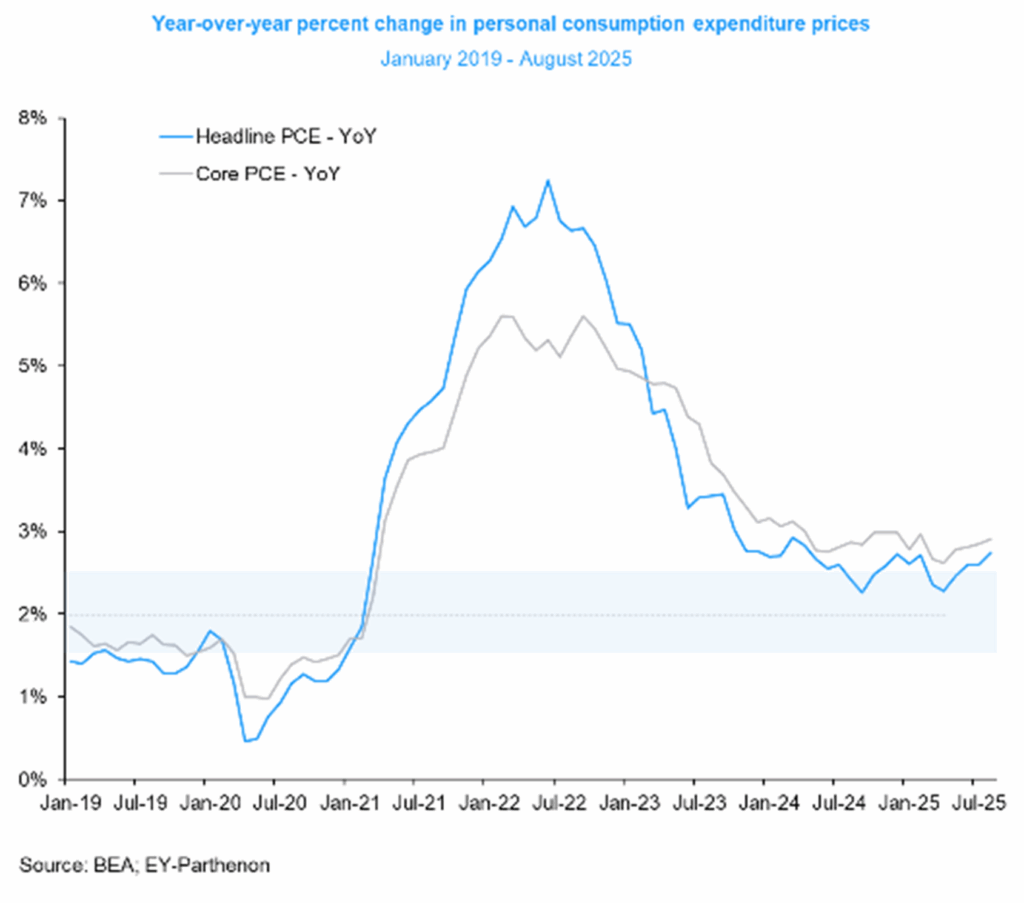
Source: EY Parthenon, Bureau of Economic Analysis. Data as of September 26, 2025.
- Fed cut rates: The Federal Reserve, for its part at least, took note. On September 17, policymakers delivered a 0.25 percentage point “risk-management” rate cut, signaling that they’re more concerned about unemployment spiraling than tariff-induced inflation. The move provided a tailwind for bonds, where high starting yields had already set the stage for a strong year. The Bloomberg U.S. Aggregate Bond index is now on pace for its best annual performance since 2019.[4]
- Gold glitters: But wait, there’s more: gold, the quintessential safety asset, is also soaring, up 44.8% year-to-date, putting the metal on track for its best year in nearly 50 years.[5] This rise has been propelled by central bank purchases, Chinese investor interest, and, more recently, US investors stepping in through ETF purchases. All three of these investor groups have a desire to own a portfolio instrument that they believe can maintain value, even in periods of high inflation or currency depreciation. Gold’s rally also means three major asset classes – stocks, bonds, and gold – which often move in different directions, are rising in tandem.
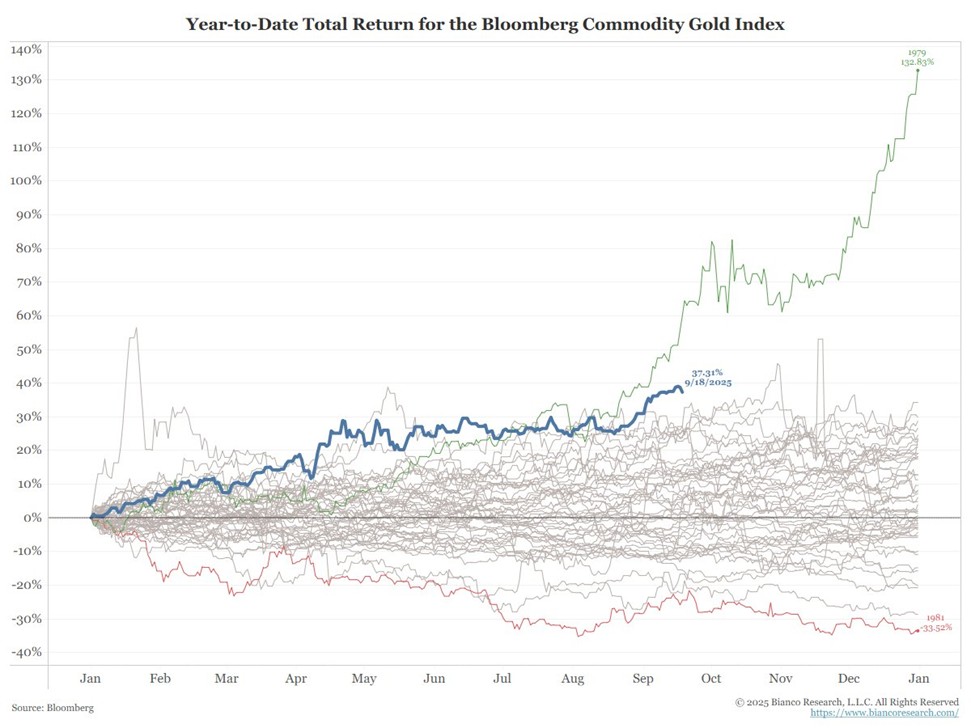
Source: Bianco Research, Bloomberg. Data as of September 19, 2025.
Past performance is not indicative of future results. The commentary may utilize index returns; however, you cannot invest directly into an index without incurring fees and expenses of investment in a security or other instrument.
- Multi-Strats mixed: Multi-strategy hedge funds, by contrast, have delivered more mixed results, with YTD returns ranging from 5% to 16%.[6] The dispersion underscores how challenging it’s been for active managers to find value outside the dominant market themes. We’ll explore this topic in more detail below.
You Say You Want a Revolution
One question we’ve been hearing frequently from clients is how slowing growth, sticky inflation, and falling rates can all coexist with markets at record highs. We believe the answer lies in three powerful dynamics shaping the economy beneath the surface.
- Shockingly good earnings: The most straightforward answer is that companies continue to show resilience that defies market expectations. For the second quarter of 2025, analysts forecasted 4.8% earnings growth year-over-year for the stocks in the S&P 500 – not shabby by any means, but definitely a cautious estimate, curbed by tariff uncertainty. Instead, companies delivered an astounding 12.0%, marking the third consecutive quarter of double-digit earnings growth.[7]
- A secular theme emerging in AI: Part of the reason for this impressive beat was the fact that the Magnificent Seven (Nvidia, Microsoft, Meta, Google, Apple, Tesla, and Amazon, also known as the “Mag 7”), and in particular the hyperscalers in that group (Meta, Microsoft, Amazon, Google, and Nvidia) continue to power market leadership.[8] In the second quarter, the Mag 7 grew earnings at 26.6% year-over-year, while the rest of the market improved by a still-healthy 8.1%.[9]
The effects of AI investment are just as visible in the real economy. According to the report that published the graph below, GDP growth averaged at 1.4% in Q1 and Q2 of 2025. It’s estimated that capex on three GDP categories – computers and peripherals, software, and data centers – collectively drove more than 70% of this growth, as shown below.
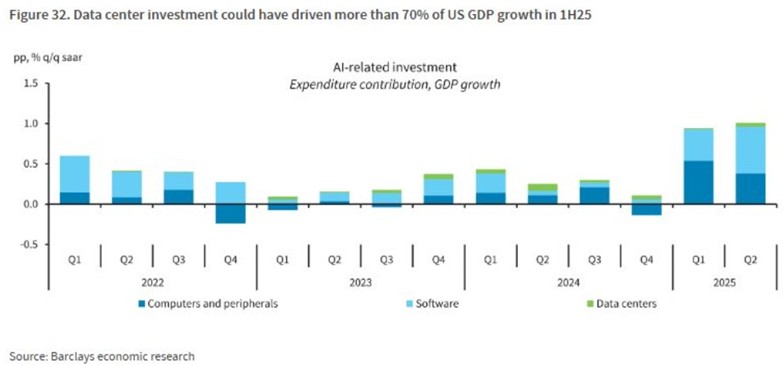
Source: Barclays Economic Research. Data as of September 26, 2025.
- Productivity growth has remained resilient: While payroll growth has stabilized since the summer’s data revisions, the labor market remains wobbly beneath the surface.
- The job market is extremely tough on young people right now, especially recent grads. The unemployment rate for college educated workers aged 22-27 has reached its widest spread compared to all workers since data began in 1989.[10]
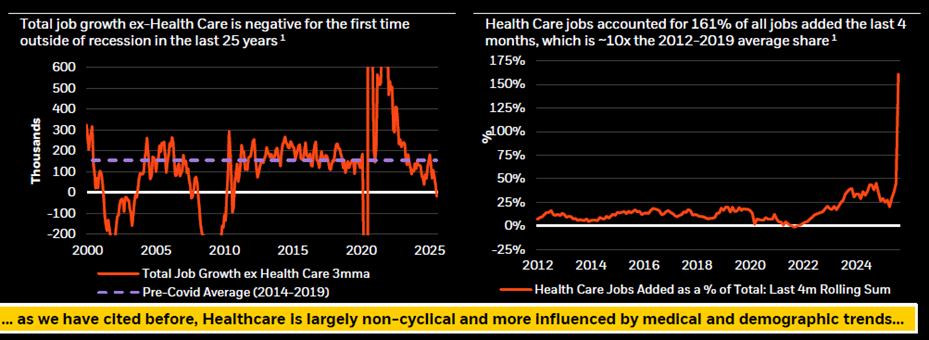
- Collectively, all non-farm employment categories except healthcare shrank in the past three months through August 2025. Healthcare added roughly 114,000 jobs over the period while all other categories lost roughly 26,000 jobs.[11]
- That’s the first time in the last 25 years (outside of a recession) that total job growth ex-healthcare was negative, as shown below.
Source: BlackRock, Bureau of Labor Statistics (BLS). Data as of September 5, 2025.
So what’s keeping the economy in the game right now? We believe the answer is productivity – in effect, companies and individuals doing more with less. That efficiency should not only support margins and earnings, but also buy time for the broader economy to adjust to shifting labor dynamics and evolving policy.
Look Down
One of the questions we hear most often is whether the AI capex cycle is a bubble. The unsatisfying truth is that we won’t know until we have the benefit of hindsight. Bubbles aren’t created by high expectations; they’re created by misguided assumptions. Whether today’s AI boom fits the former or the latter is still an open question.
What we do believe is that, for now, the market really is a tale of two cities: one that is heavily susceptible to the outcome of the AI arms race, and one that is not. Because so much market value is concentrated in the former, the landscape is riskier today than it was even two years ago. The companies that dominate the major indices are increasingly tied to a single big bet. That concentration presents challenges, but also potential opportunities.
- In the public markets, we remain selective in the face of intense optimism and continue to favor active management in large-cap growth, where many of the Mag 7 companies live. Rich valuations among the hyperscalers demand caution, but their long track records of exceeding investor expectations cannot be ignored.[12]
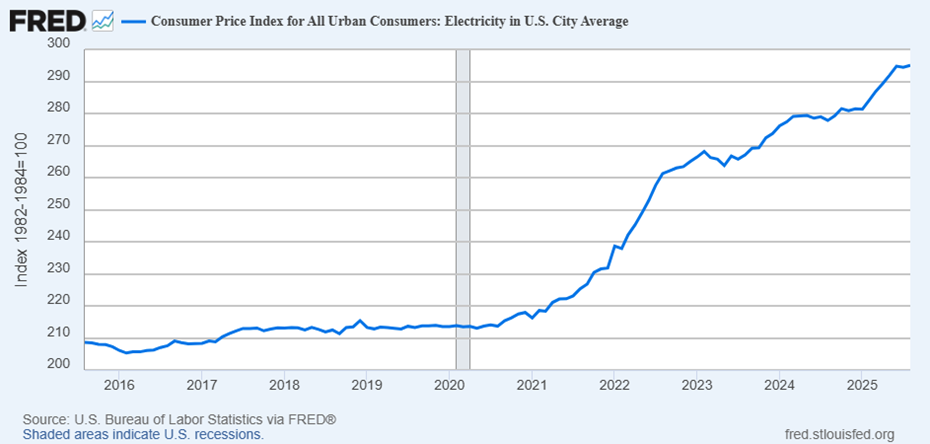
- Outside of the public markets, we like investment ideas that are associated with the artificial intelligence boom, but there are a lot of unknowns in the long run. We remain focused on the things that are changing here and now. One clear example is energy. As AI-driven power demand surges, utility costs for consumers are rising. We’ve allocated to infrastructure strategies that aim to meet that growing need, while also providing diversification benefits and potential tax-efficient income.
Source: U.S. Bureau of Labor Statistics. Data as of September 11, 2025.
- American households are also living their own version of a “Tale of Two Cities.” In the second quarter, the top 10% of consumers account for nearly half of all consumer spending – the highest level ever in data going back to 1989.[13] For the other 90% of consumers, tariffs remain a looming threat. As a result, we seek to focus on quality in our fixed income portfolios, especially in our consumer-facing debt.
- However, rate cuts could offer a reprieve to the bottom 90% of consumers given that they are more likely to borrow at floating rates.[14] Rate cuts may also have a knock-on benefit in asset classes such as real estate, which have been left behind in the rally so far. We also have a major stimulus coming during tax refund season as the One Big Beautiful Bill tax cuts take effect. [15]
Great Expectations
The economic story of 2025 is increasingly one of dual realities. On the surface, the data show an expansion that is losing steam: hiring is slowing, inflation progress has plateaued, and Fed economists anticipate the economy will cool in the fourth quarter to a 1.5-2.0% annual 2025 growth rate – well short of the 2.8% growth we experienced in 2024.[16] But just beneath, a powerful transformation is underway. Consumers remain surprisingly durable, margins continue to expand, and companies are investing heavily in technologies that aim to redefine productivity for a generation. These two forces – cyclical speed bumps and structural innovation – are colliding in real time.
A natural question might be how this collision will impact our investments. Unfortunately, we can’t know for sure; economic uncertainty is a fixture of markets. The amount of uncertainty rarely changes – what does change, though, is investors’ awareness of the potential risks.
We find that even three years removed from the last 20%+ market correction, peoples’ awareness of these types of events tends to fade. Across market cycles, our approach is anchored in a consistent framework designed to balance opportunity with these risks. In particular, we:
- Remain globally diversified and cost-conscious in our public equity exposures, with a close eye on risk management
- Seek hedged strategies in credit that allow us to expand beyond the more-trafficked areas of traditional sovereign and corporate debt and aim to earn incremental income for doing so
- Identify asset classes that may be undergoing secular changes, such as infrastructure, and re-underwrite them to new long-term outcomes
- Allocate to all-weather multi-strategy hedge funds that have the tools designed to capitalize on a variety of market conditions
With both stocks and bonds on track for another stellar year though, the traditional 60/40 portfolio is having its day in the sun. In an environment like this, it’s fair for investors to question whether additional diversification is worth the effort. If the two core building blocks of a portfolio are both delivering strong returns, why bother expanding beyond them?
In our view, there is a simple answer: the 60/40 portfolio is built on the assumption that stocks and bonds will behave differently. Bonds are supposed to act as a ballast when stocks start to struggle. That negative correlation is what gives the portfolio its diversifying power. If both asset classes are moving in the same direction, that cushion disappears. That’s exactly what happened in 2022, when rising inflation and interest rates drove declines in both stocks and bonds simultaneously, leaving many investors worse off than if they had simply owned equities alone. Unfortunately, this outcome is more common in inflationary environments.
When stocks, bonds, and even alternative assets like gold all rally in unison, diversification becomes more important – not less. Building resilience into portfolios is critical because the push and pull between cyclical headwinds and structural innovation isn’t going away. Neither is the uncertainty that comes with it. Our focus is on building portfolios that can potentially thrive – even in a tale of two cities.
As always, if you have any questions, don’t hesitate to reach out.
Charts We Loved This Quarter
1. While it may seem like the Mag 7 continues to get more expensive, they’ve actually gotten cheaper over the year to date relative to their earnings growth.
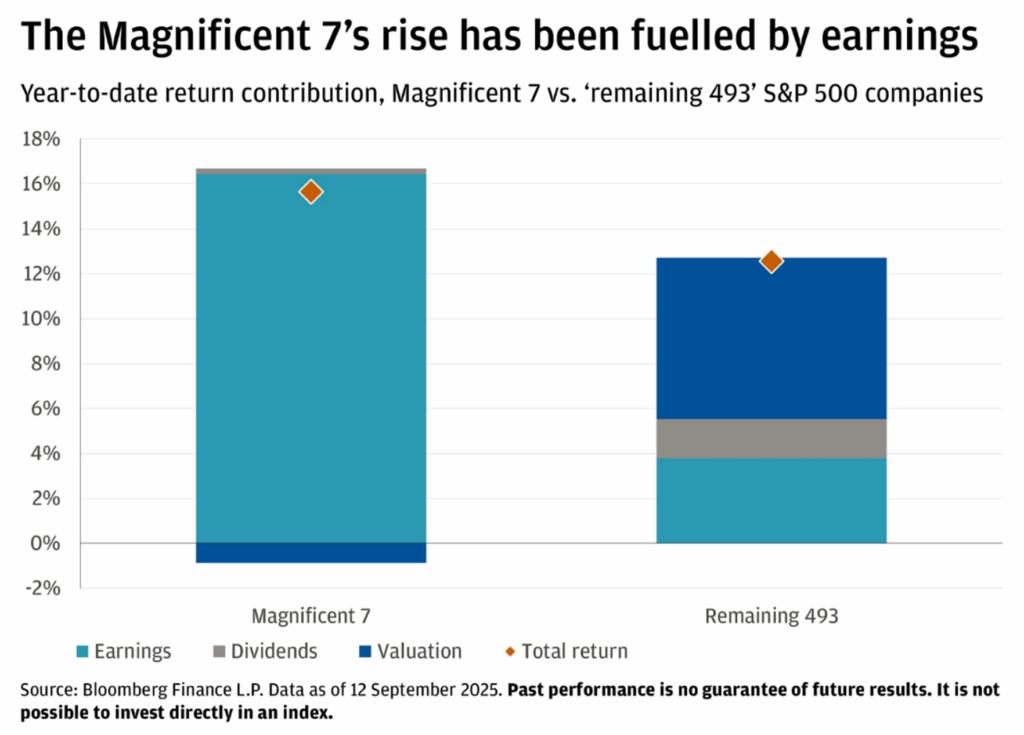
Source: JPMorgan, Bloomberg Finance L.P. via Linkedin. Data as of September 12, 2025.
2. Broadening the aperture, the largest TMT stocks today are not nearly as expensive as the top stocks at the height of the tech bubble, explaining dominance to date.
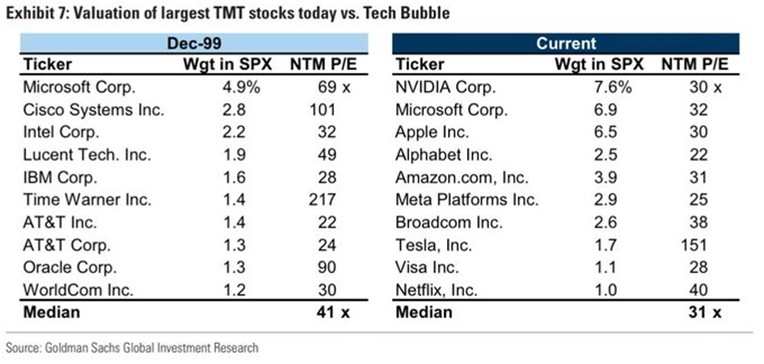
Source: Goldman Sachs Investment Research via X. Data as of September 24, 2025.
3. But as those earnings compound, tech names are growing as a share of the index and crowding out other exposures. Defensive stocks are at their lowest ever weighting in the S&P 500 going back to 1990, increasing the risks in the event of a market correction.
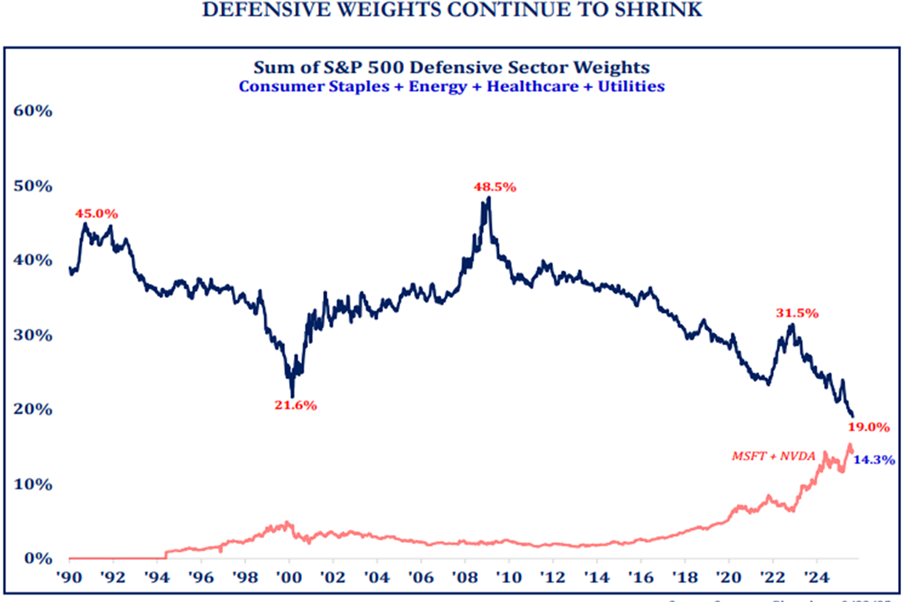
Source: Strategas, Bloomberg. Data as of September 22, 2025.
There is no guarantee that any investment strategy, investment recommendations or decisions will achieve its objectives, generate profits or avoid losses. Past performance is not indicative of future results. The commentary may utilize index returns; however, you cannot invest directly into an index without incurring fees and expenses of investment in a security or other instrument.
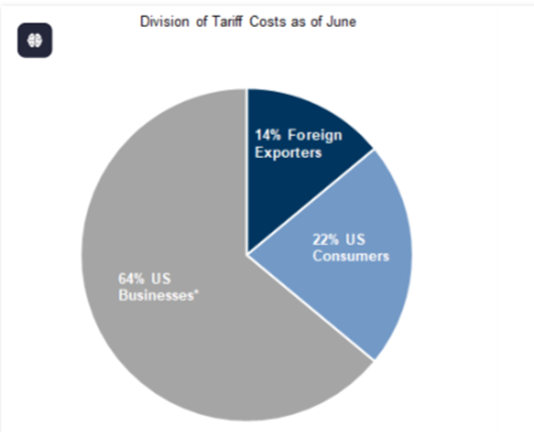
4. Generally speaking, though, consumers have not been bearing most of the costs of the tariffs. Neither have foreign exporters. Instead, it’s the companies that sit in the middle – the Home Depots and Walmarts of the world – that have been footing the bill, for now. That’s expected to change in the first half of next year during tax refund season, a time when many prices could get raised, and typically have.
Source: Goldman Sachs Investment Research via X. Data as of August 10, 2025.
5. However, underneath the surface, several key categories – such as appliances and laundry equipment – that are particularly sensitive to tariffs are starting to increase in price, subverting general deflationary trends.
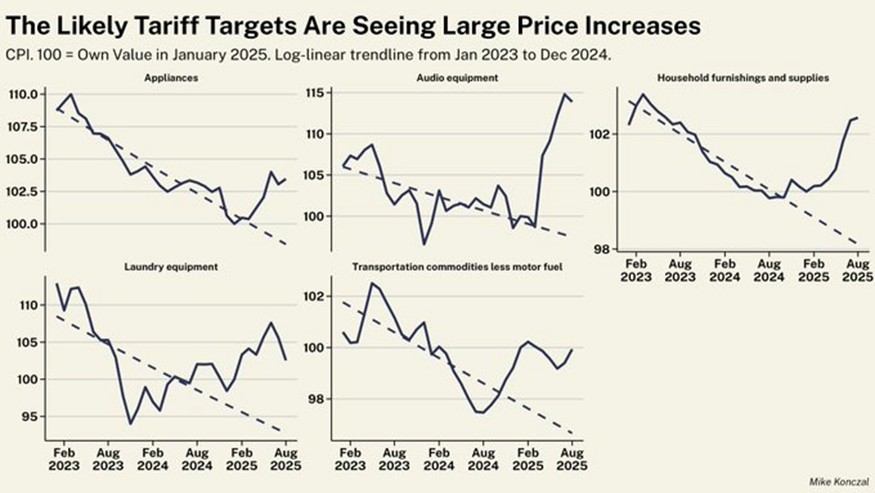
Source: Mike Konczal, Senior Director Policy and Research, Economic Security Project, via X. Data as of September 11, 2025.
6. International stocks have been performing strongly YTD, as we’ve discussed in prior commentaries. But much of that growth has been driven by currency effects (as we’ve discussed), as well as multiple expansion (meaning, a stock’s price increasing as a % of its current base of earnings). Only the US has seen a meaningful component of its returns come from true earnings growth.

Source: J.P. Morgan Asset Management, Guide to the Markets
– U.S. FactSet, MSCI, Standard & Poor’s. Data as of September 30, 2025.[17]
7. However, there are some select areas internationally where profits are at least improving – Japan is a notable example.
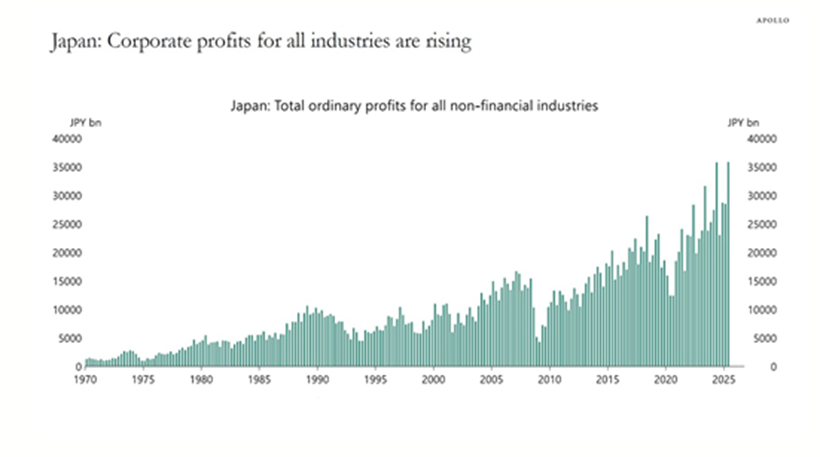
Source: Ministry of Finance Japan, Bloomberg, Macrobond, Apollo Chief Economist (Daily Spark).
Data as of October 3, 2025.
8. This chart demonstrates the magnitude of the jobs revision back in July in terms of absolute numbers – in other words, how many jobs the figure was revised by. As you can see, this revision was the biggest outside of COVID going back to 1979.
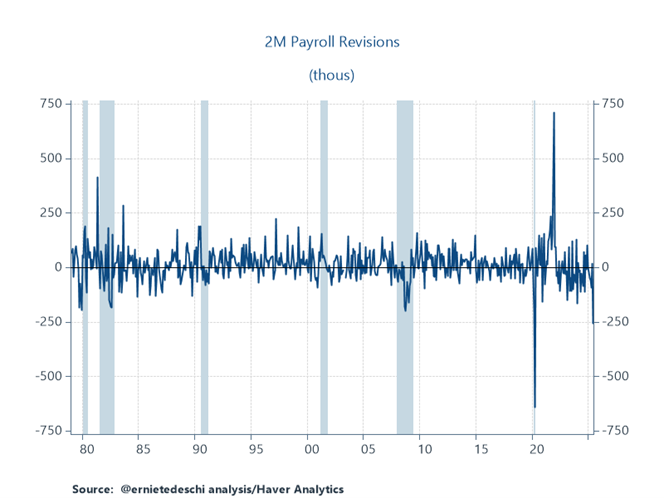
Source: The Budget Lab, Haver Analytics. Data as of August 1, 2025.
9. However, it’s important to keep in mind that our population has grown a lot since the late 70s. So as a percentage of the overall jobs base – meaning, how many people are employed in non-farm related job – the size of revisions has been trending down over time, and the July revision was no exception. (Please note that this chart takes into account the August revisions as well, hence the slight bounce from the bottom.)
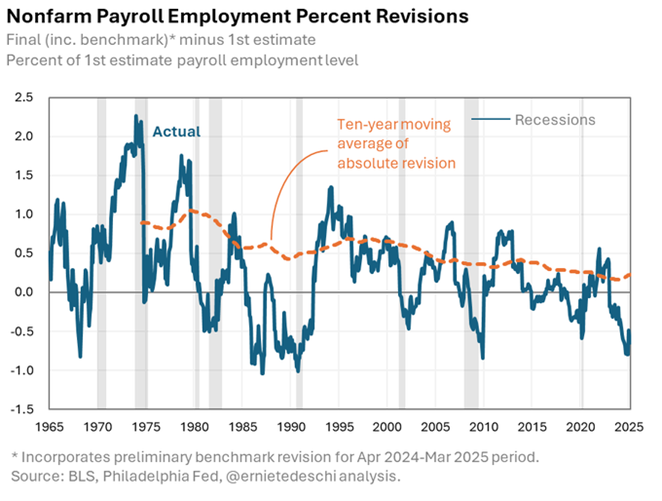
Source: The Budget Lab, BLS, Philadelphia Fed. Data as of September 9, 2025.
10. In terms of how massive the transition in employment is from other sectors into healthcare, just look at the top employer in each state in 1990 vs. 2024.
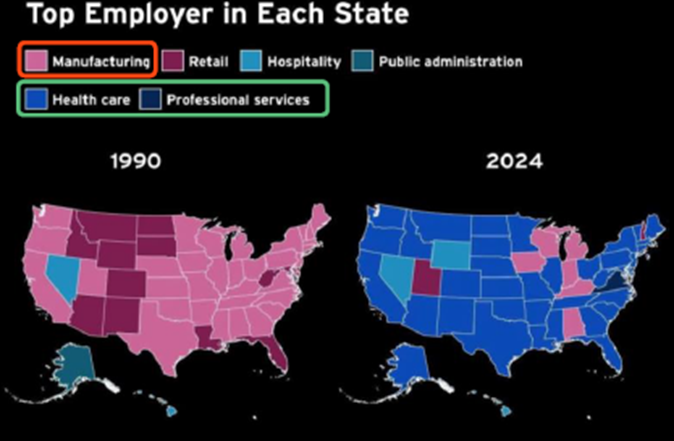
Source: The New York Times, BlackRock. Data as of July 22, 2025.
11. Finally, we’d like to leave you with two charts that help to describe the scope of the AI buildout. In terms of construction spending, data centers could overtake office buildings in the fourth quarter or early next year.
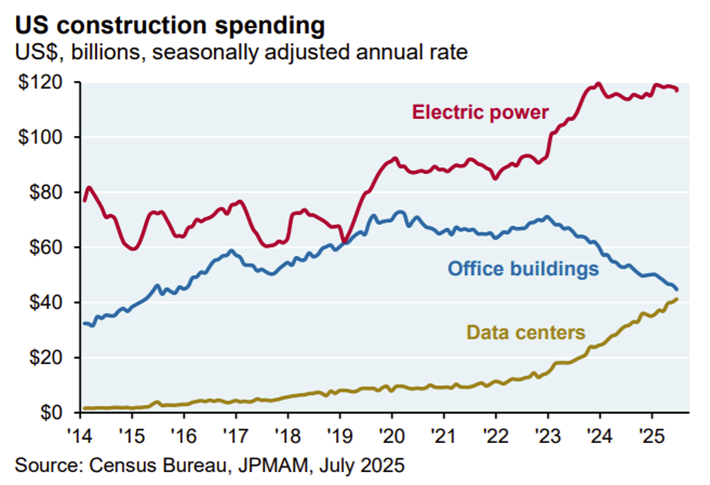
Source: JPMorgan, Census Bureau, via X. Data as of July, 2025.
12. You also might have seen headlines throwing out the gigawatt capacity of some of these data centers, generally the 2-5 gW range. But what is a gigawatt? Well, a single 5-gigawatt facility can use around 40 million megawatt-hours of electricity annually – roughly equivalent to the total power consumption of Nevada or Kansas.
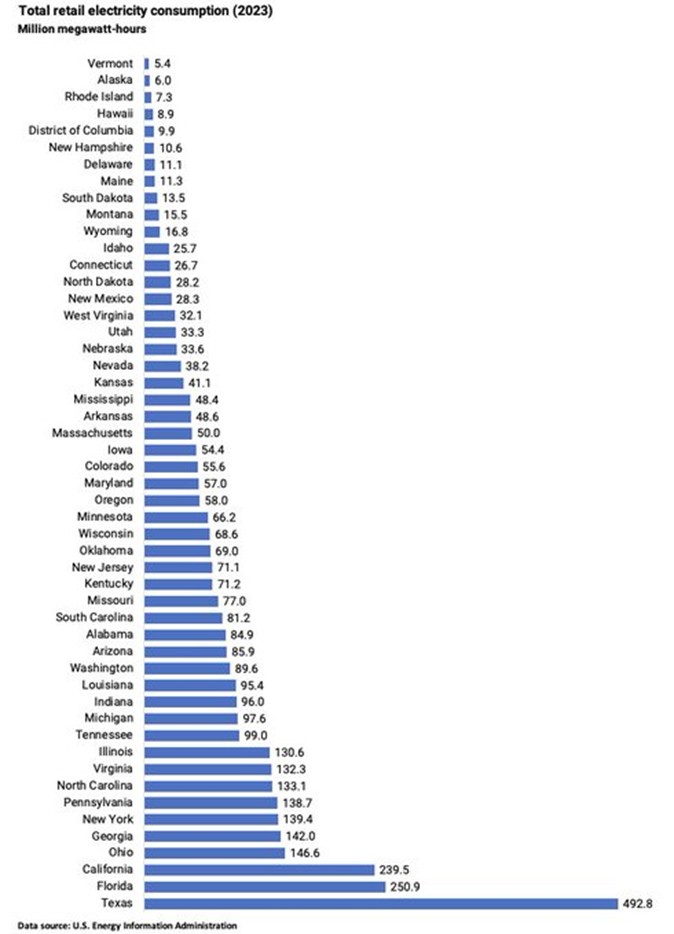
Source: Jesse Jenkins, Professor of Mechanical and Aerospace Engineering at Princeton, with data from the US Energy Information Administration, via X. Data as of July 22, 2025.
Market Indices
S&P 500 INDEX: S&P 500 index is a float-adjusted market-cap weighted index, largely reflecting the large-cap U.S. equities. The index includes 500 leading companies and captures approximately 80% coverage of available market capitalization.
RUSSELL 2000 INDEX: A comprehensive view of small-cap performance, the Russell 2000 measures the performance of approximately 2,000 small-cap US equities.
MSCI AWCI EX USA INDEX: The MSCI ACWI ex USA Index captures large and mid-cap representation across 22 of 23 Developed Markets (DM) countries (excluding the US) and 24 Emerging Markets (EM) countries*. With 2,156 constituents, the index covers approximately 85% of the global equity opportunity set outside the US.
MSCI ACWI EX USA US DOLLAR HEDGED: The MSCI ACWI ex USA US Dollar Hedged Index represents a close estimation of the performance that can be achieved by hedging the currency exposures of its parent index, the MSCI ACWI ex USA Index, to the USD, the “home” currency for the hedged index. The index is 100% hedged to the USD by selling each foreign currency forward at the one-month Forward rate. The parent index is composed of large and mid-cap stocks across 22 Developed Markets (DM) countries and 24 Emerging Markets (EM) countries.
BLOOMBERG U.S. AGGREGATE BOND INDEX: The index consists of approximately 17,000 bonds. The index represents a wide range of securities, from investment grade and public to fixed income.
ICE U.S. TREASURY 20+ YEAR BOND INDEX: ICE U.S. Treasury 20+ Year Bond Index tracks the performance of US dollar denominated sovereign debt publicly issued by the US government in its domestic market. Qualifying securities must have greater than or equal to twenty years remaining term to final maturity as of the rebalancing date, a fixed coupon schedule and an adjusted amount outstanding of at least $300 million. The amount outstanding for all qualifying securities is adjusted to reduce by the amounts held by the Federal Reserve’s SOMA account. Bills, inflation-linked debt, original issue zero coupon securities and STRIPs are excluded from the Index; however, the amounts outstanding of qualifying coupon securities are not reduced by any portions that have been stripped. Agency debt with or without a US Government guarantee and securities issued or marketed primarily to retail investors do not qualify for inclusion in the index.
S&P GSCI GOLD INDEX: The S&P GSCI Gold Index, a sub-index of the S&P GSCI, provides investors with a reliable and publicly available benchmark tracking the COMEX gold future. The index is designed to be tradable, readily accessible to market participants, and cost-efficient to implement.
HFRI FUND WEIGHTED COMPOSITE INDEX: The HFRI Fund Weighted Composite Index is a global, equal-weighted index of single-manager funds that report to HFR Database. Constituent funds report monthly net of all fees performance in U.S. Dollar and have a minimum of $50 Million under management or a twelve (12) month track record of active performance. The HFRI Fund Weighted Composite Index does not include Funds of Hedge Funds.
CORE PCE (PERSONAL CONSUMPTION EXPENDITURES”) INDEX: The PCE Price Index Excluding Food and Energy, also known as the core PCE price index, is a measure of prices that people living in the United States, or those buying on their behalf, pay for goods and services. It’s sometimes called the core PCE price index, because two categories that can have price swings – food and energy – are left out to make underlying inflation easier to see.
Commentary Contributors
Eric Gerster, CFA®
Chief Investment Strategist
Johann Lee, CFA®
Director of Research
Edward J. Durica, III, CFA®
Senior Wealth Advisor
Madeline Hume, CFA®
Senior Research Analyst
Dr. David Stubbs
Chief Investment Strategist
Sources
[1] Source: Koyfin, Morningstar. Data as of 10/1/2025.
[2] Source: During the dot-com boom the index actually went on a five-year streak of double-digit returns, from 1995 to 1999. Source: Morningstar, NYU Stern. Data as of 10/1/2025.
[3] Source: U.S. Bureau of Economic Analysis, “Personal Income and Outlays, August 2025,” news release (September 26, 2025).
[4] Source: Morningstar. Data as of October 1, 2025.
[5] Source: Uberti, David, and Eisen, Ben. “Gold Hasn’t Rallied This Much Since 1979.” Wall Street Journal. September 15, 2025.
[6] Source: Source: Mackenzie, Nell, and Sen, Anirban. “How hedge funds performed in September.” Reuters. (October 8, 2025.)
[7] Source: Butters, John. “Earnings Insight.” Factset. (September 26, 2025.)
[8] Source: A “hyperscaler” provides cloud computing and data management services to organizations that require vast infrastructure for large-scale data processing and storage. Key examples include Amazon Web Services (AWS), Microsoft Azure, and Google Cloud Platform (GCP). Any issuers or securities noted in this document are provided as illustrations or examples only, for the limited purpose of analyzing general market or economic conditions and may not be used for the basis of an investment decision. AlphaCore is not recommending the purchase, sale or holding of any security and is making no representation or indication of its own holding of any securities. AlphaCore makes no representation as to whether any security or issuer mentioned in this presentation is now in any AlphaCore portfolio. AlphaCore, its employees or clients may have positions in the securities or investments mentioned in this publication, which are subject to change without notice. Past performance is not indicative of future results.
[9] Source: Butters, John. “Earnings Insight.” Factset. (August 29, 2025.)
[10] Source: U.S. Census Bureau and U.S. Bureau of Labor Statistics, “Current Population Survey (IPUMS),” news release. (August 1, 2025)
[11] Source: Bureau of Labor Statistics (BLS). Data as of October 5, 2025.
[12] Source: J. P. Morgan Asset Management, FactSet, Standard & Poor’s. Data as of September 30, 2025.
[13] Source: Marte, Jonnelle. “Top 10% of Earners Drive a Growing Share of US Consumer Spending.” Bloomberg. (September 16, 2025.)
[14] Source: Casselman, Ben and Smialek, Jeanna. “High Interest Rates Are Hitting Poorer Americans the Hardest.” New York Times. (May 14, 2024.)
[15] Source: Watson, Garrett, and Van Ness, Peter. “2026 Tax Calculator: How the One Big Beautiful Bill Act’s Tax Changes Will Affect You.” Tax Foundation. (October 1, 2025.)
[16] Source: Federal Reserve Open Market Committee. Data as of September 17.
Disclosure
This material is being provided for informational purposes only. This material represents the current views and opinions of AlphaCore Capital, and there is no guarantee that any opinions will prove to be accurate, or any forecasts made will come to pass. No obligation is undertaken to update any information, data or material contained herein. AlphaCore provides investment advice only within the context of our written advisory agreement with each AlphaCore client. AlphaCore is not recommending the purchase, sale or holding of any security. Information provided does not constitute an offer or solicitation, and should not be considered tax, legal, or accounting advice.
There is no guarantee that any investment strategy, investment recommendations or decisions will achieve its objectives, generate profits or avoid losses. Past performance is not indicative of future results. All investments are subject to a degree of risk. Risks can include, but are not limited to, increased market volatility, reduced liquidity, or loss of value, including initial invested capital. Alternative investments and strategies are subject to a set of unique risks Gold and other precious metals may be referred to as a “safe haven” investment or generally presented as a safety asset. These references should not be construed to ensure or guarantee any form of investment safety. Any specific security or strategy is subject to a unique due diligence process, and not all diligence is executed in the same manner. No level of due diligence mitigates all risks, and does not guarantee the elimination of market risk, failure, default, or fraud.
Before embarking on any investment program, you should carefully consider the risks and suitability of a strategy based on your own investment objectives and financial position.