The First Cut Is The Deepest
Last month, AlphaCore welcomed our clients, investment partners and other esteemed guests to La Jolla for our second annual Wealth Summit. The event’s timing was auspicious, occurring just 24 hours after the Fed’s hotly anticipated September FOMC meeting on September 18, 2024. This provided fertile ground for thought-provoking conversations with leading experts from across the investment management industry.
As expected, the Fed lowered interest rates for the first time in four years. What the markets were unsure of was whether Federal Reserve Chair Jay Powell would start small, with a 0.25 percentage point cut, or go big. It was the latter – a 0.5 percentage point reduction, only the second time in the past 15 years a cutting cycle has been initiated with a cut of this magnitude.
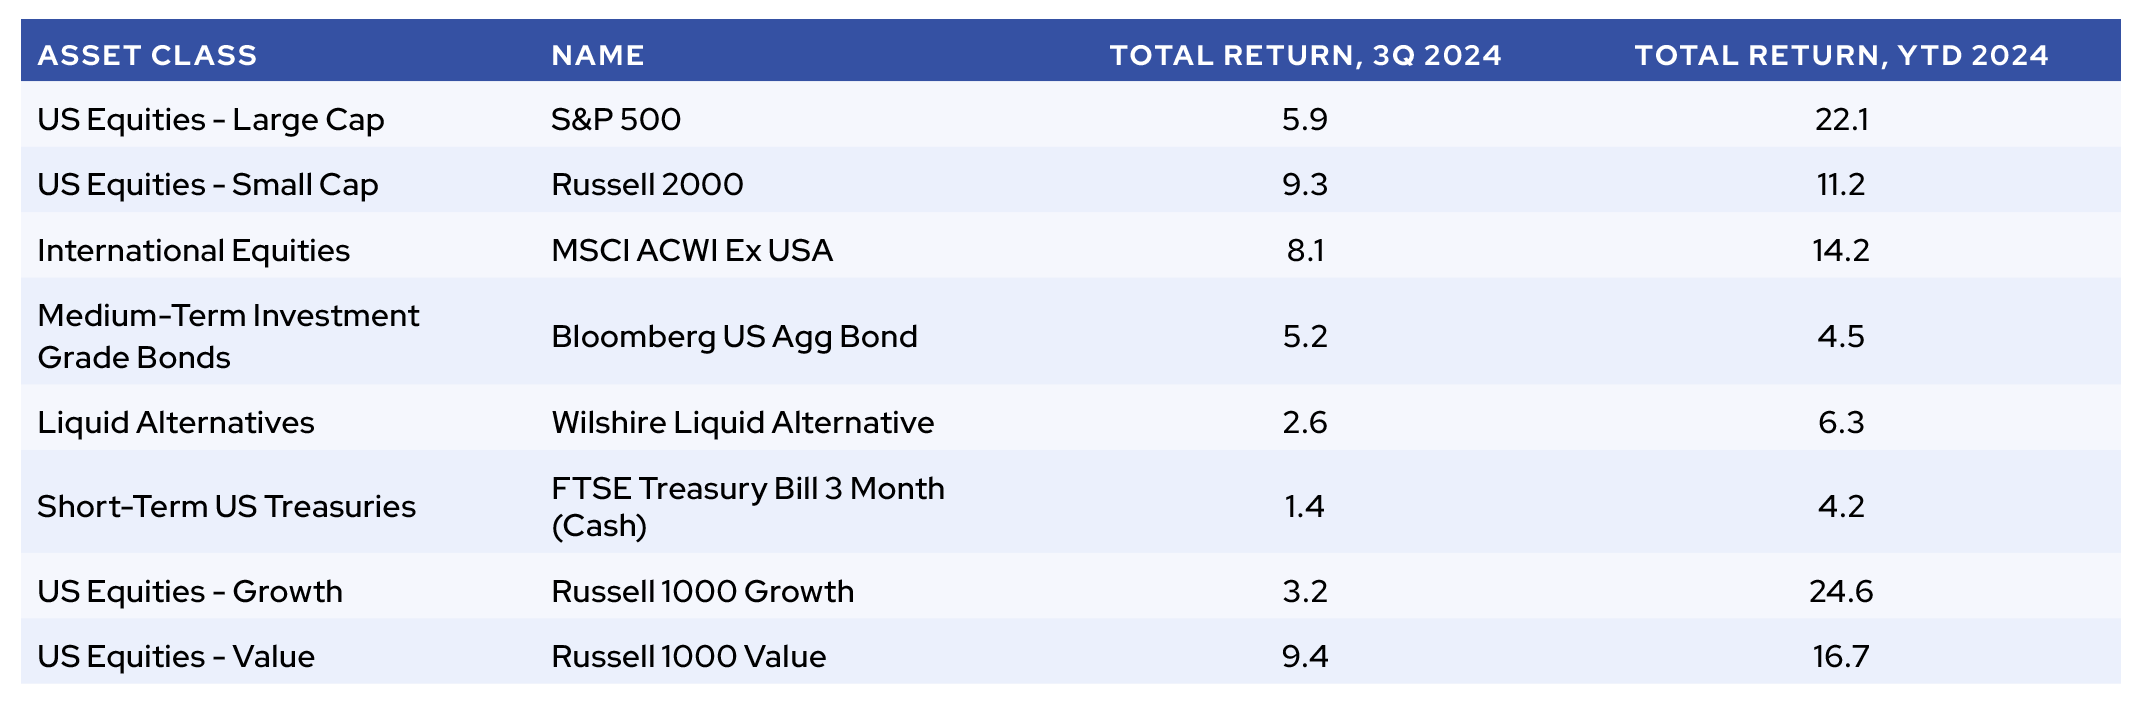
We would argue that the size of the cut was appropriate, mainly because the Federal Reserve’s previous policy was too restrictive: the previous Federal Funds rate of 5.25-5.5% was reached in an attempt to quash the inflationary episode that peaked at 7.3% in the summer of 2022. Those inflationary fears have largely subsided, as headline PCE (the Fed’s preferred measure) is now trending at 2.2%.[1] Markets concurred and soared – stocks surged to a record high on the following day, with the S&P 500 index closing out the quarter up 5.9% and returning 22.1% YTD through September.[2]
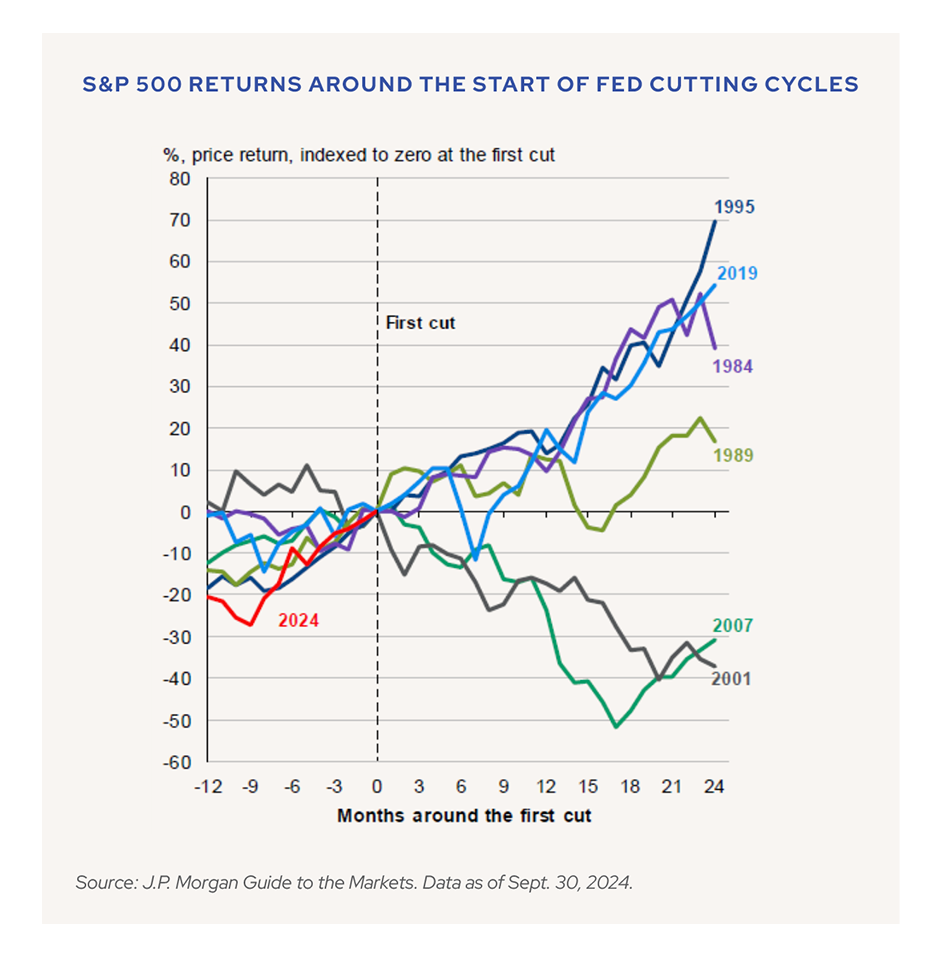
Nevertheless, the steepness of the cut may leave investors wondering if the economy is worse off than it appears. It is true that a 0.50 percentage point cut has typically preceded recessionary conditions. Powell attempted to quell these worries in his speech, clarifying that the reduction in rates is intended to be a “recalibration” closer to neutral policy rather than a reaction to deteriorating conditions.[3] The bond market has largely accepted this narrative, and has now priced in a cutting cycle typical of a soft landing (or non-recessionary) environment.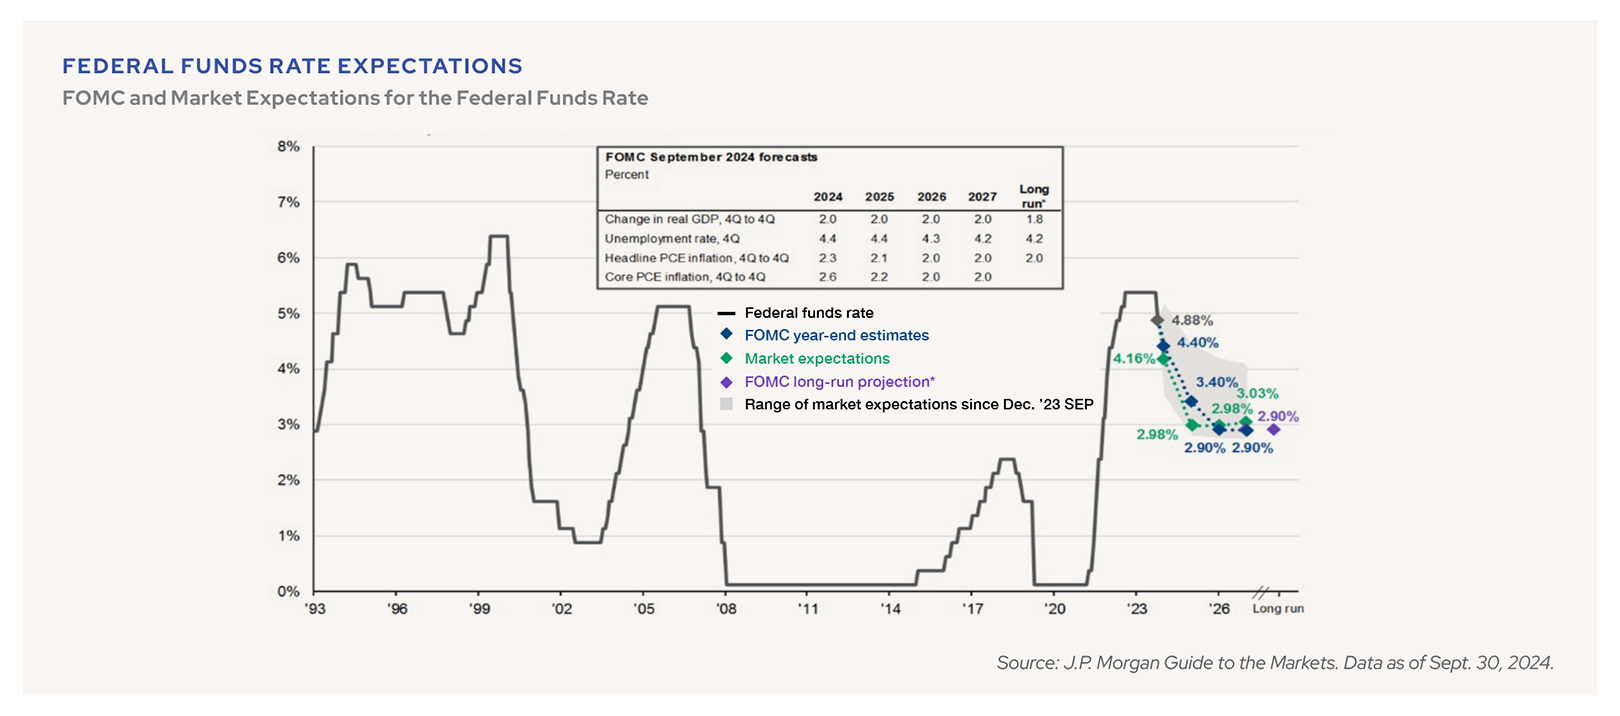
Going forward, the Federal Reserve’s policy rate trajectory hinges on the U.S. economy remaining resilient; indeed, median Fed forecasts indicate consistently solid 2% growth, with the unemployment rate stabilizing just 0.2% above current levels.[4] As inflation has subsided and the balance of risks shift more towards maintaining full employment, it’s important to keep in mind that a gradual cutting cycle is predicated on these rate cuts working to stem the negative trends appearing on the periphery of the labor market data.
Let’s look at what happened in the third quarter across the capital markets before turning our attention back to what is sure to be an action-packed end of the year.
BUYING INTO BREADTH
Notwithstanding a sharp but brief pullback in early August, the equity market had a very strong third quarter. Although they certainly helped results, the anticipated rate cuts weren’t the main story here: instead, it was the broadening trend we anticipated finally beginning to take root. The parts of the stock market that had previously suffered most outperformed, with U.S. value stocks beating growth by six percentage points and small caps rallying 9.3%.
Source: Morningstar. Data as of Oct. 3, 2024.
As the broadening trend has gathered steam, even cheap stocks have gotten more expensive. Current price/earnings (P/E) multiples remain well above historical averages for both the S&P 500 and the Russell 2000 indices. This remains true even when you screen out the largest companies; for instance, the bottom 490 names in the S&P 500 have a current P/E ratio of 18.4x, well above the historical average of 15.7x from 1996-present.[5] (When current valuations are high, there is a higher threshold for strong future returns.)
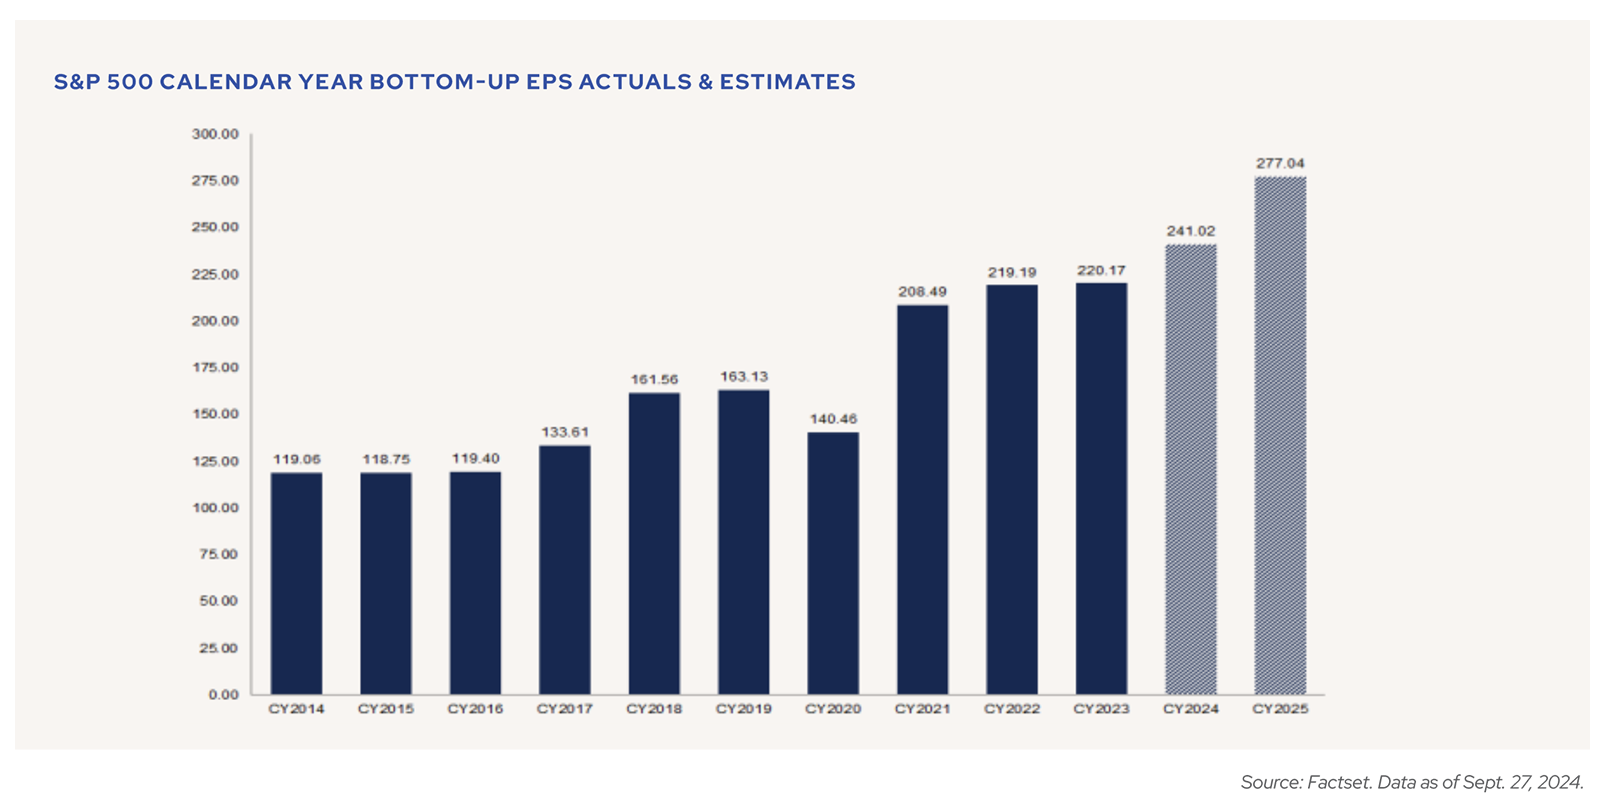
In addition, these price/earnings multiples are based on forward earnings expectations that can fairly be characterized as lofty. The S&P 500 is on track to deliver double-digit earnings growth in 2024, and earnings per share estimates for 2025 crossed $275 in September, which would represent 15.1% earnings growth year-over-year.[6] The S&P has only reported consecutive years of double-digit earnings growth twice in the past 15 years.[7] Any wobbles from individual companies that fail to live up to these forecasts will be punished by the markets. To contend with this, our equity strategy prioritizes stocks that currently trade at more reasonable valuations today relative to history, although we also acknowledge that there are a handful of blue-chip names that continue to grow their earnings at an accelerating pace. These idiosyncratic cases can justify a higher valuation and may also find a place in our portfolios.
BONDS ARE BACK
Bonds also rallied, with the Bloomberg Barclays U.S. Aggregate index up 5.2% for the quarter.[8] Increased anticipation of Fed rate cuts caused yields to fall and bond prices to rise.[9] Between June 30 and September 30, markets revised their mid-2025 forecasts for interest rates from 4.4% to 3.2%.[10] The shift in investors’ expectations for interest rates was supportive for government bonds, and the yield on the 10-year U.S. Treasury fell from 4.4% to 3.8% over the quarter.[11]
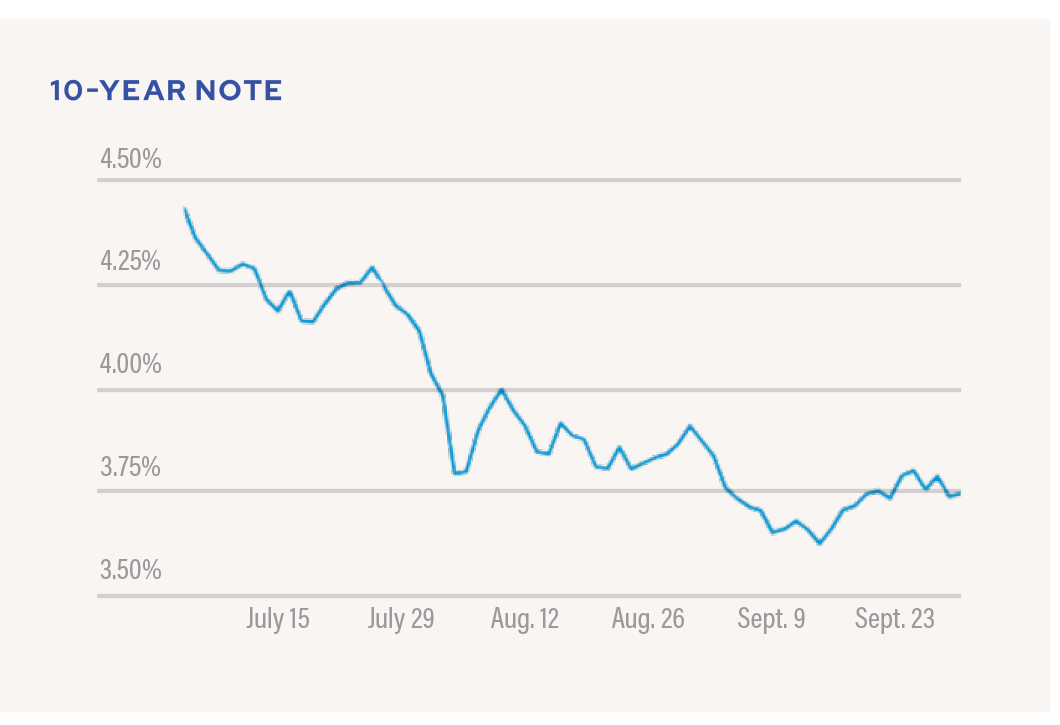
Source: Wall Street Journal. Data as of Oct. 1, 2024.
However, this may be a touch optimistic. We believe a 3.8% yield over the next ten years does not fully compensate investors for the risks presented by our current macro backdrop – which may include bigger deficits, heightened geopolitical tensions, a messy energy transition, and higher services inflation. Thus, we prefer shorter maturities typically of 5 years or less.
The benefit to investing in bonds at the moment is that the margin of safety is wide enough to provide solid downside protection. Investors can enjoy healthy returns without having to extend into longer-maturity bonds and still keep credit quality high. Investment grade (IG) bonds returned 5.8% and mortgage-backed credit printed 5.5% — both outperforming high yield, which posted a 5.3% return.[12] Cash, on the other hand, looks less attractive as short-term yields fall.
ALERTING ALTERNATIVES
The outlook on private credit, one of our highest-conviction asset classes over the past several years, is solid but the influx of new capital has us watching closely for signs of change. The Cliffwater Direct Lending Index currently yields 12.3% over the trailing twelve months ending Q2 2024.[13] However, substantial inflows year to date have left these managers flush with capital. The top seven publicly traded private managers originated a staggering $121 billion in private credit in Q2 2024, compared to just $49.5 billion in Q3 2023.[14] As the market becomes more crowded and competition for deals has increased, we expect average yields to fall.
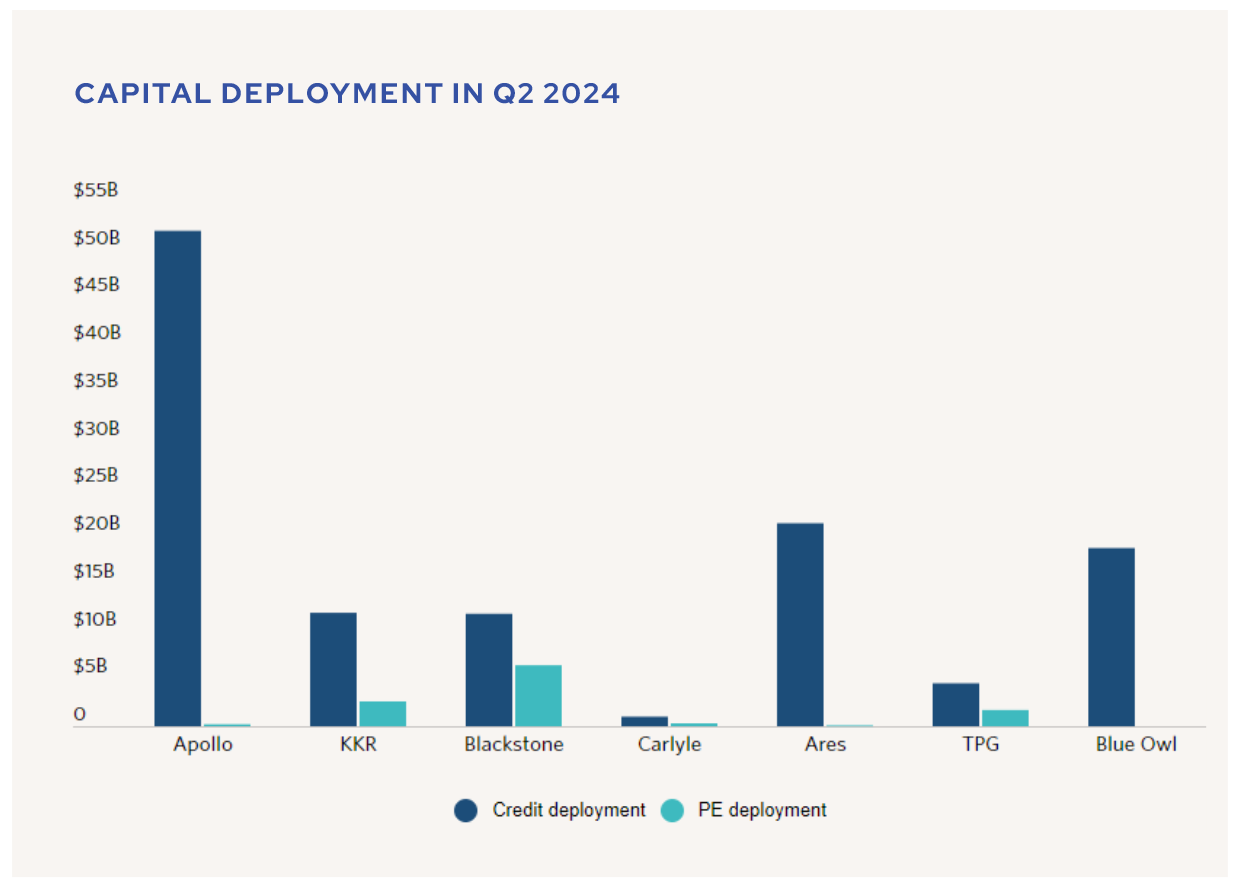
Source: Pitchbook. Data as of Oct. 1, 2024.
We continue to like alternative credit—structured debt and real estate lending in particular–for its broader opportunity set. Commercial real estate activity has picked up, driven by lower rates and a need to refinance. As the glut of new multi-family housing supply gets absorbed in late 2025 to 2026, it’s likely that rent growth will recover as well. These factors may lead us to increase exposure to real estate equity for the first time in several years.
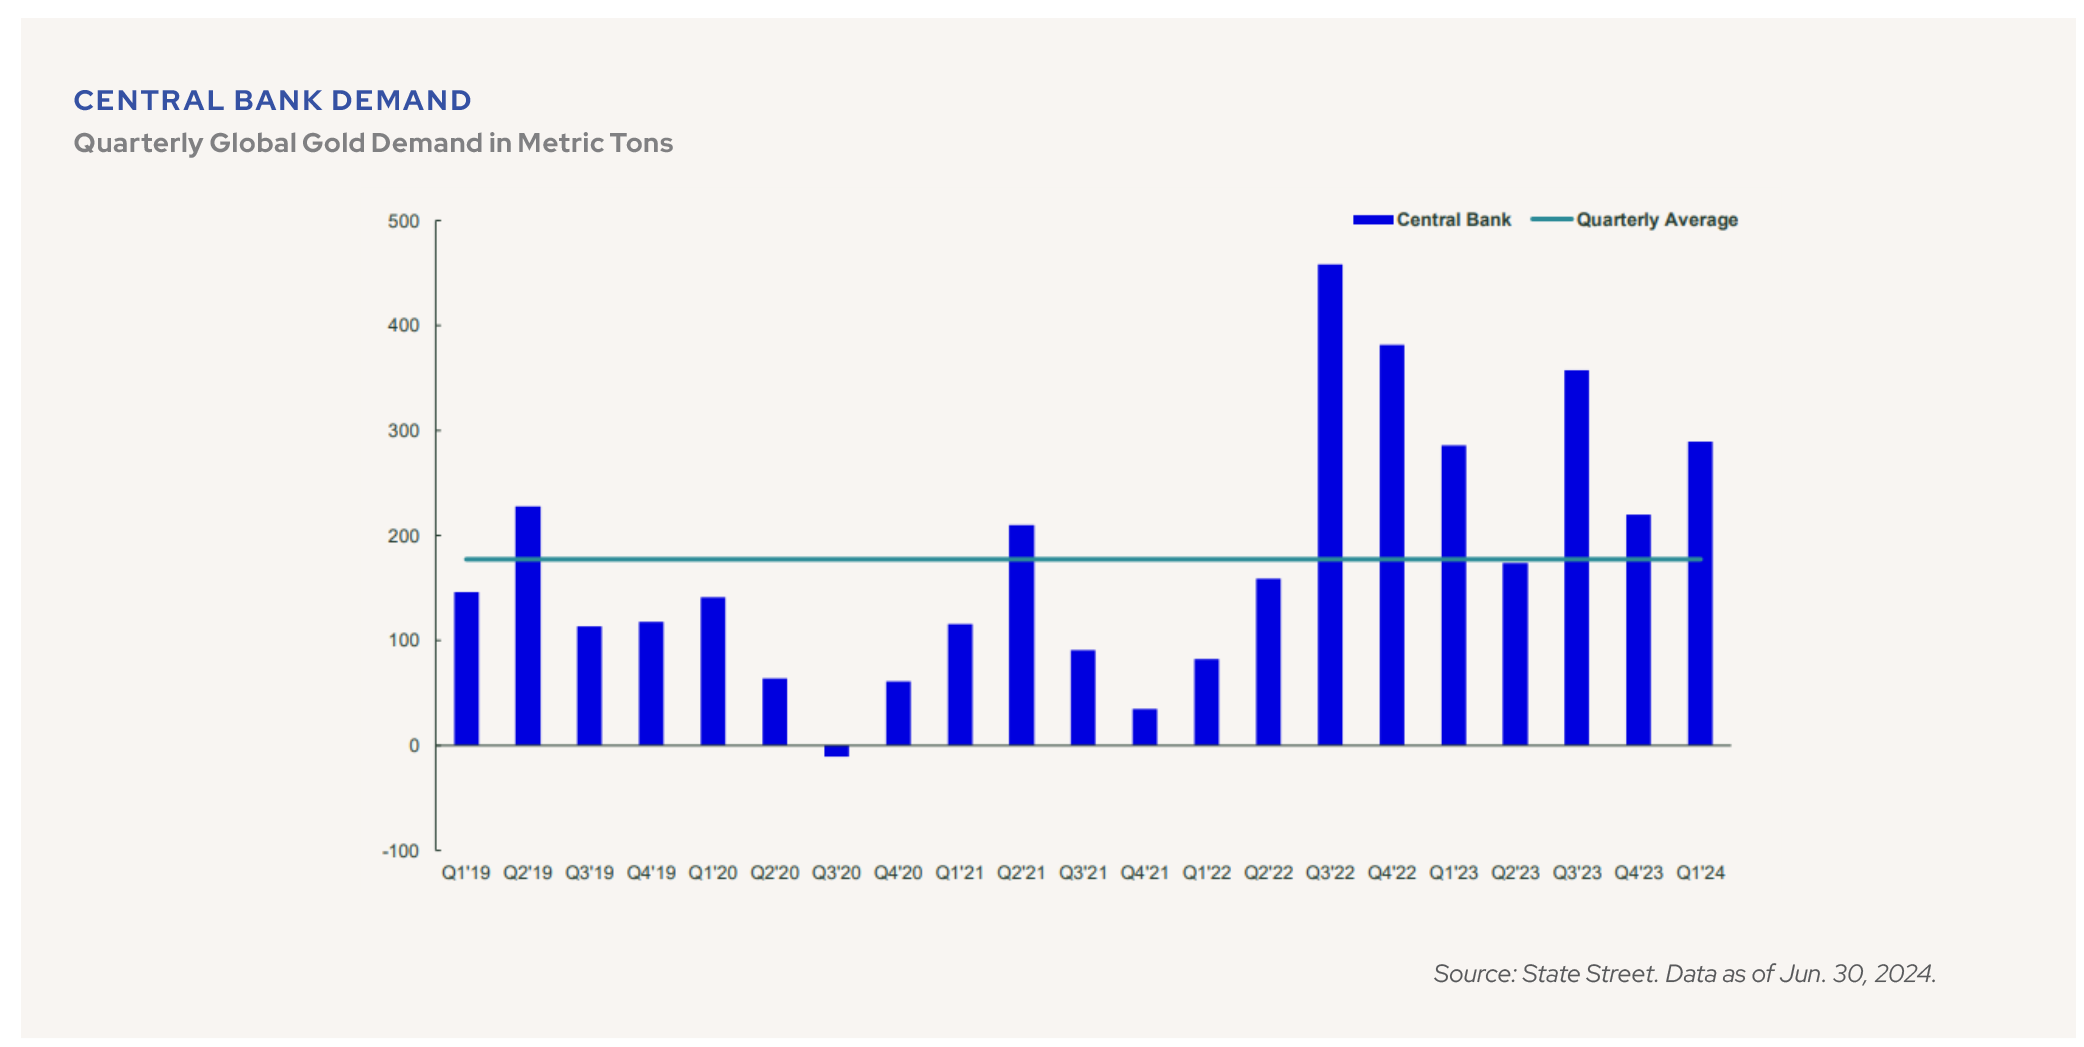
Alongside an expanding deficit and election-related uncertainty, rising geopolitical tensions abroad have triggered a flight into safe haven assets like gold, which has returned 28.4% YTD through September.[15] This has been driven by central bank reserve accumulation, as sovereigns reduce their U.S. Treasury holdings for gold.
Outside of gold, the situation in China is potentially supportive for commodities more broadly. In late September, the People’s Bank of China unveiled a broad stimulus package that includes rate cuts and 2 trillion yuan (about $280 billion U.S. dollars) worth of special sovereign bonds.[16] This is expected to push commodity prices higher – immediately after the announcement on September 24, Brent crude was up 1.3%, copper futures surged to a two-month high and silver futures hit a decade-plus high.[17],[18]
Higher input costs for raw materials, especially if they occur in lockstep with increased infrastructure or real estate development, may trigger a feedback loop where we see inflation begin to tick up again. In light of these recent events, we are considering whether a potential allocation to commodities or other hard assets might be prudent.
LET IT BE
After a day of conversations on topics such as these, we capped off our wealth summit with a private concert by the Fab Four, a Beatles cover band that transported attendees back in time to the Swinging Sixties. But some of our clients may not need a cover band to feel like they’ve been transported back in time.
Politically speaking, we can draw many parallels between our current era and the sixties, particularly 1968. Similar to that consequential year, our current presidential election has been peppered with assassination attempts, anti-war protests, and a relatively unknown vice president thrust into the national spotlight at the Democratic National Convention in Chicago after the incumbent surprisingly withdrew from the race.
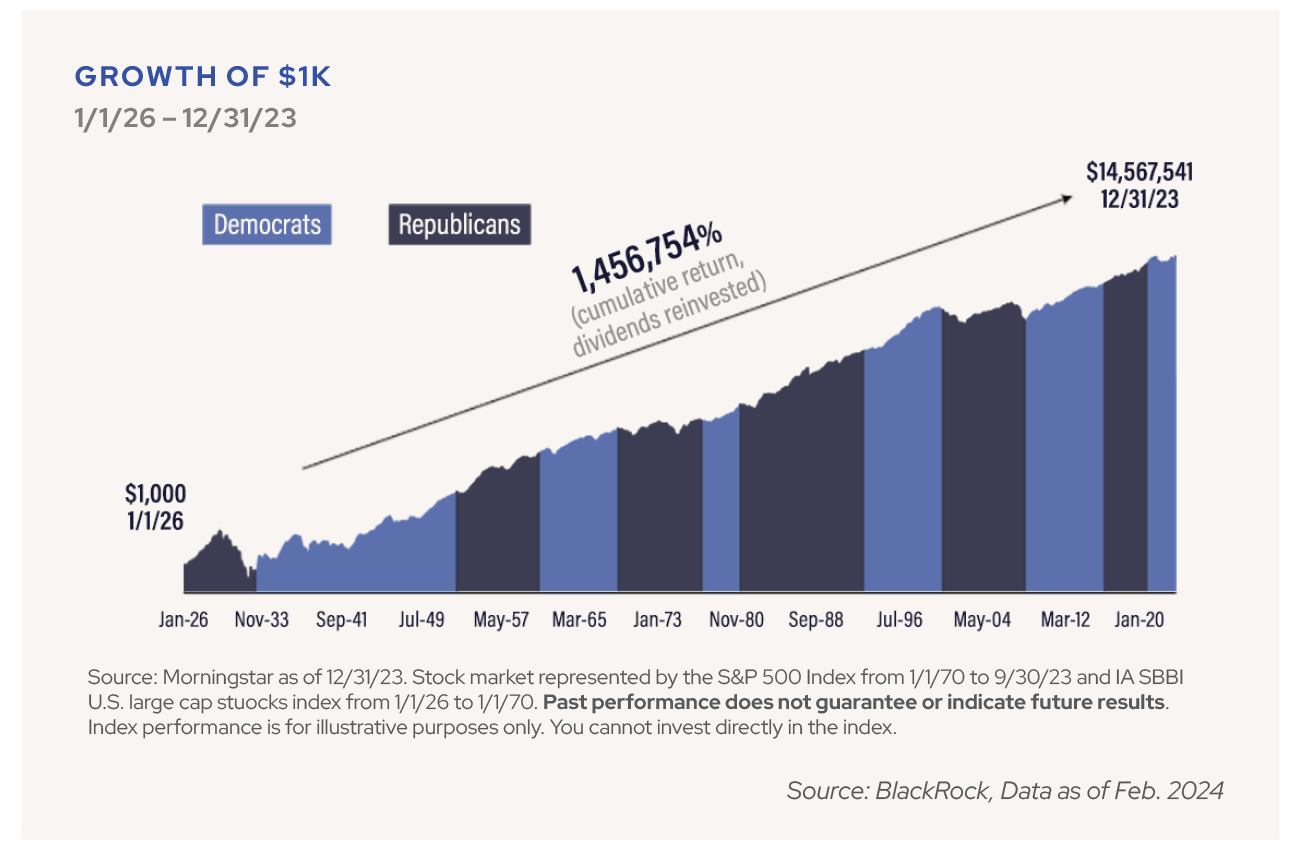
As with past cycles, our eyes are on the election and its outcome. With less than a month to go, we anticipate a ramp up in volatility as election season in America kicks into high gear. Certain sectors and industries can be affected depending on the party in power, and this certainly deserves our attention. Overall though, as history has shown, the health of the economy drives asset prices far more than the party in power at any given time.
As our world goes through a bout of central bank decoupling and geopolitical instability, more and more factors with the power to move markets come into play. This Fed easing cycle will likely contribute to easier financial conditions at a time when deficits are expanding and protectionism is on the rise – both at home and abroad. While these factors may be supportive of a healthier backdrop in the short term, as we look beyond 2025, these factors could lead to higher rates at the long end of the bond market curve. The equity markets remain fairly sanguine amid this backdrop, and early expectations for 2026 also call for double-digits earnings growth. The S&P 500 has only achieved three consecutive years of double-digit earnings growth seven times since 1960, and this type of event would be an outlier compared to the S&P’s long-run average earnings growth rate of 6.5%.[19],[20]
At AlphaCore, we believe that volatility begets opportunity. We build our all-weather solutions with the objective of withstanding whatever this next quarter brings. We consistently favor equities with favorable valuations relative to cash flow growth, alternative credit such as direct lending and structured debt, and multistrategy hedge funds that can serve as a ballast if public equities retreat. Today, we also recognize the value of traditional fixed income given higher absolute yields. Outside of substantial market moves, our long-term strategy is designed such that we don’t expect to make frequent adjustments.
The Beatles’ rise during a tumultuous chapter in history led to the creation of their innovative musical style that bridged popular music genres such as rock and roll, the blues, and pop. Just as hits like “Yesterday” and “Come Together” remain resonant over half a century onward, we strive to construct durable portfolios that will carry our clients through many different market environments and stages of life. We want our clients to know that our team is always here to “Hold Your Hand” and whatever financial obstacle you face, “We Can Work It Out.” We thank you for your continued support and please feel free to reach out to our team with any questions.
APPENDIX
A few charts we found during the quarter that you may find interesting.
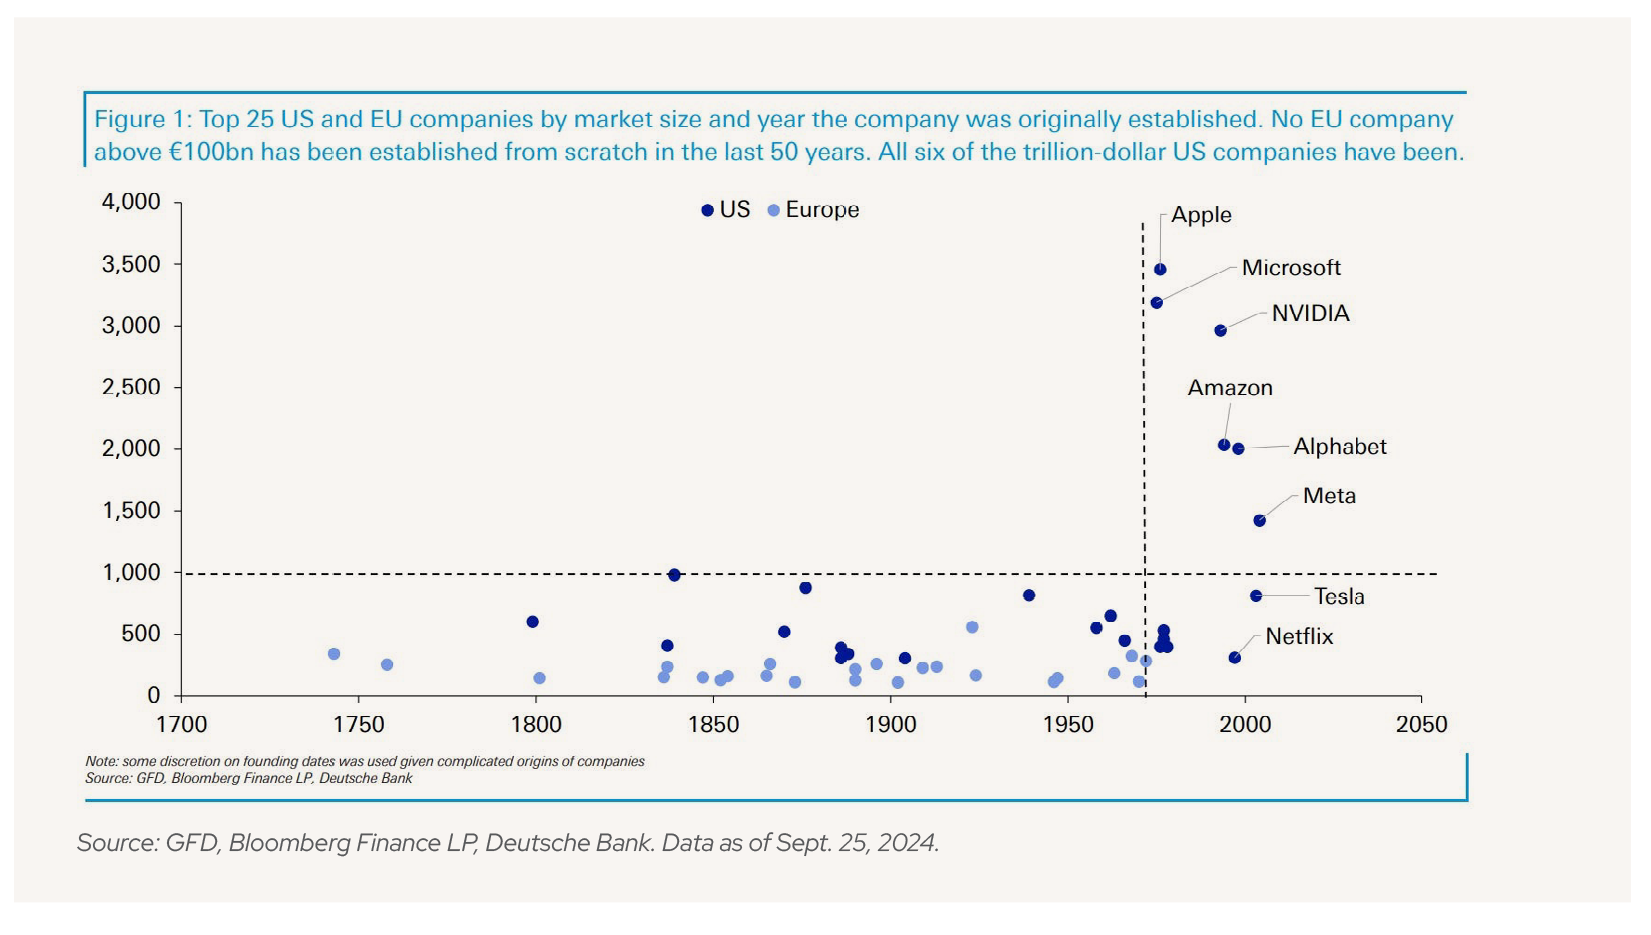
Baked from Scratch: All six trillion-dollar U.S. companies have been built from the ground up in the past 50 years.
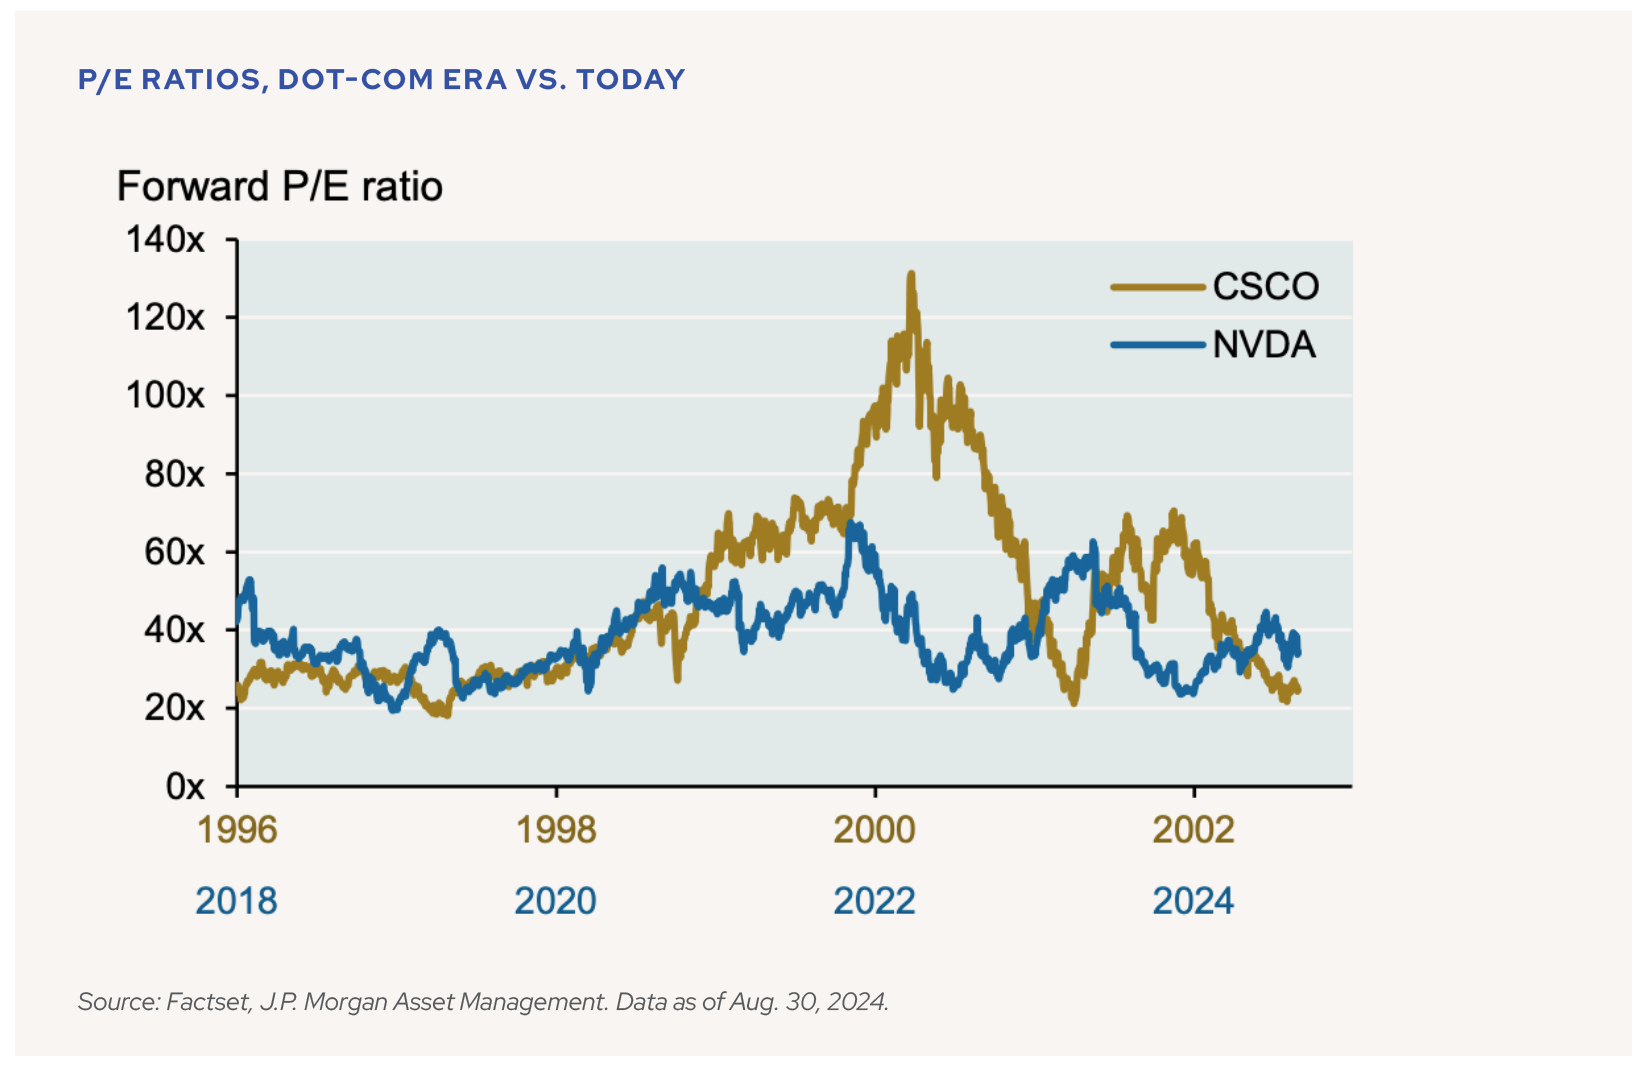
Many draw parallels between Nvidia today and Cisco at its height in the early 2000s. However, when their P/E ratios over time are viewed simultaneously, Nvidia’s valuation looks more reasonable.
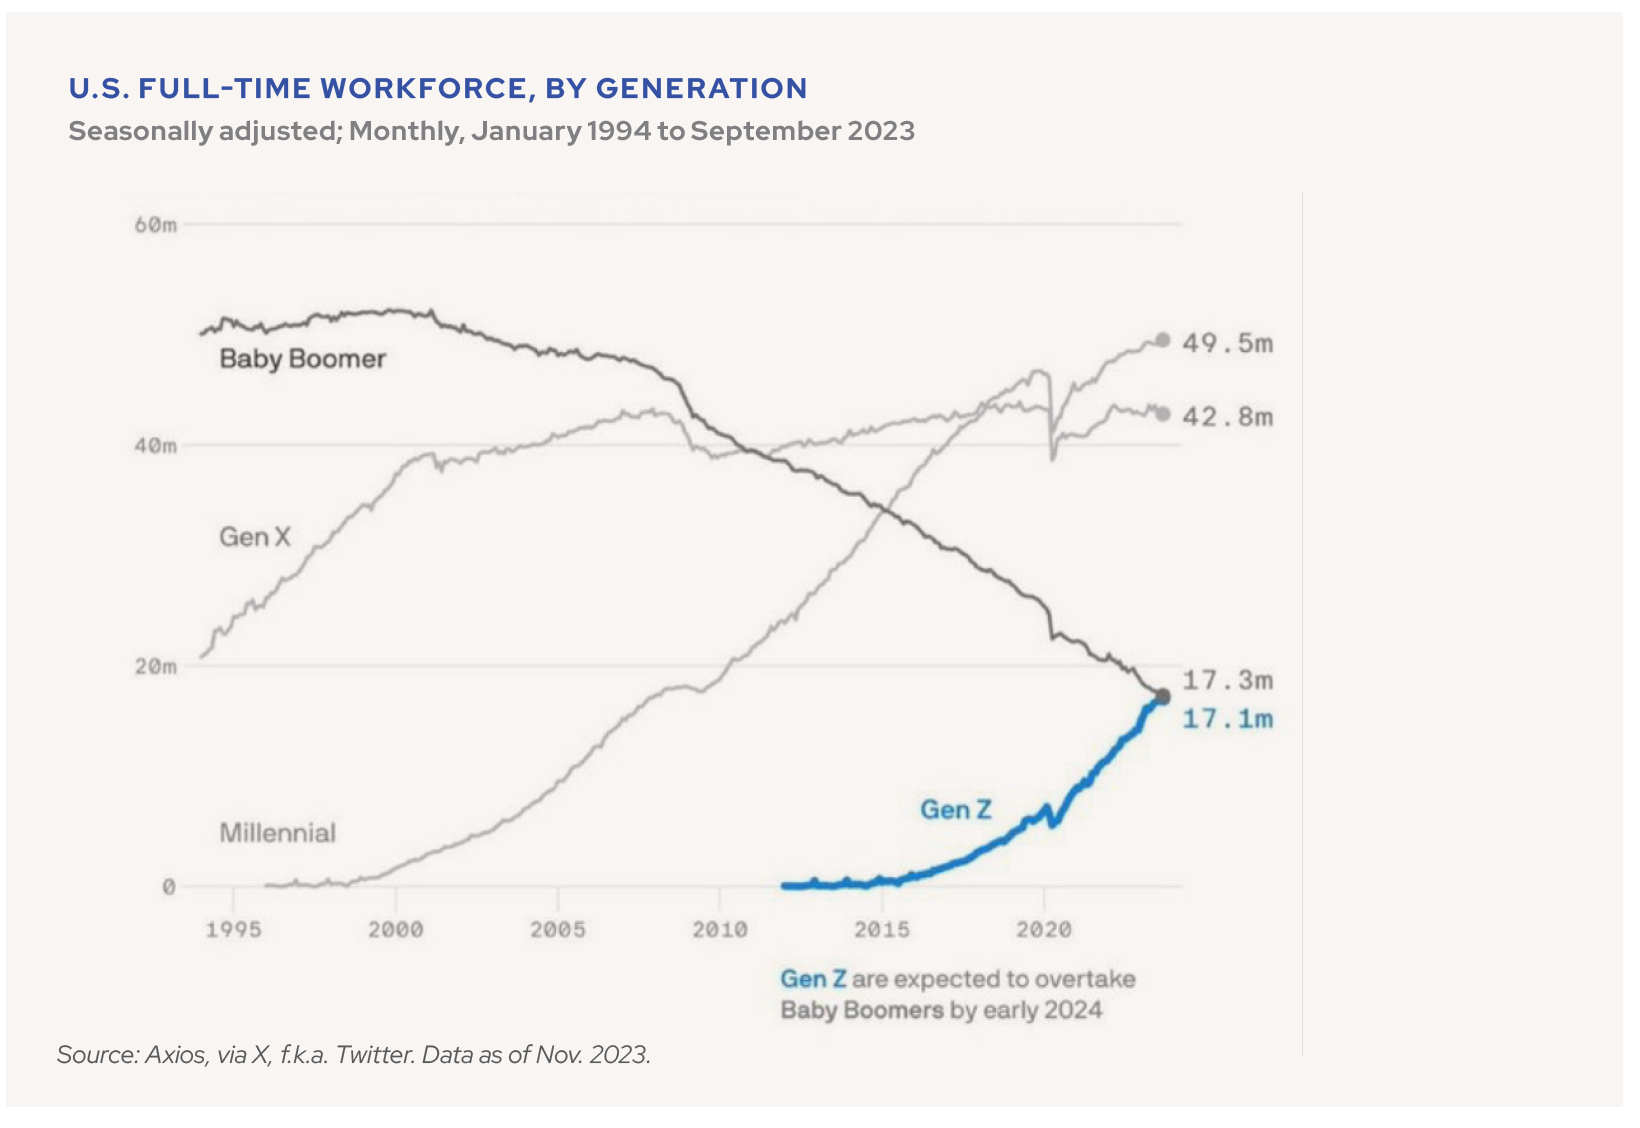
By now, Gen Z has probably surpassed the Baby Boomers in the workforce. Which would explain why we’re seeing so many articles about kids these days…
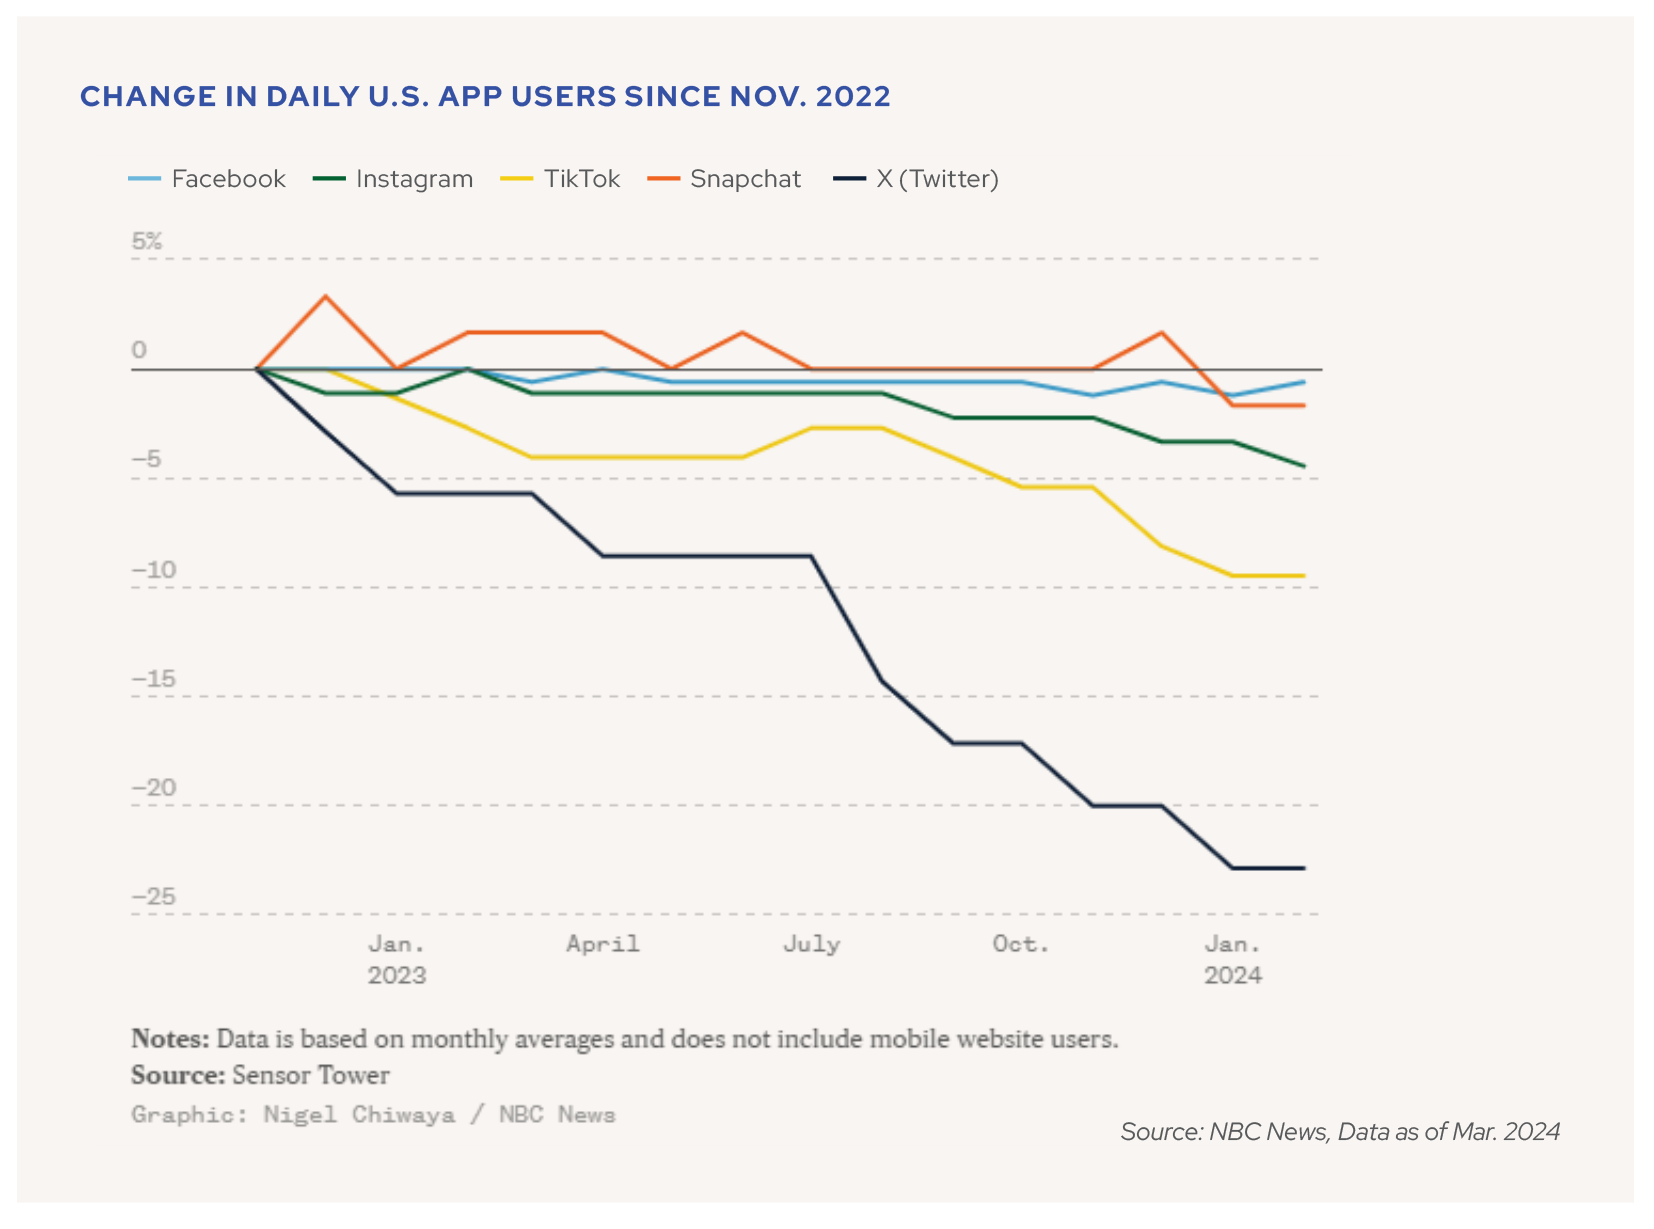
Speaking of X, fewer people are using the platform than ever before.
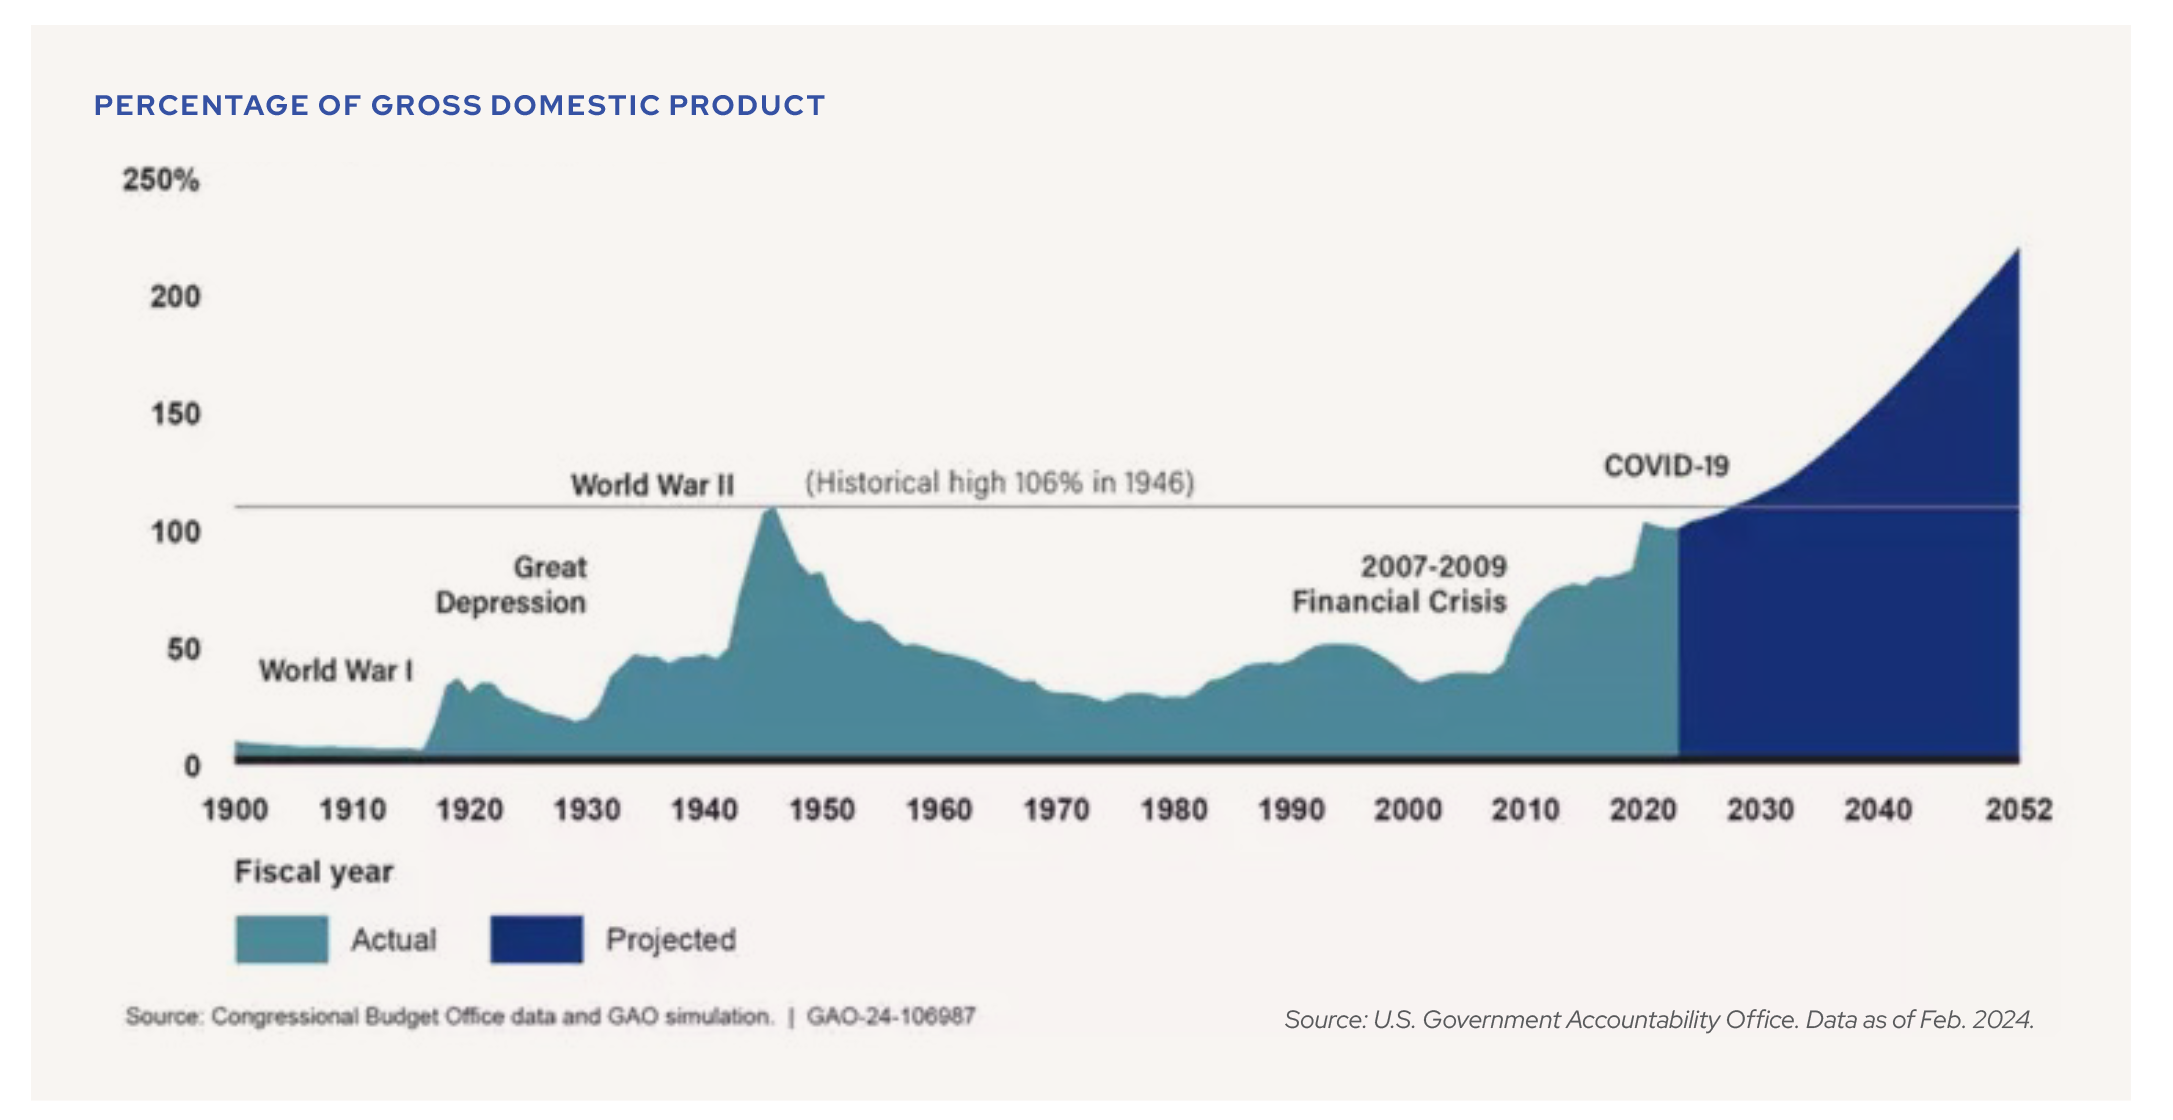
For all their ideological differences, both Trump and Harris share a propensity to spend – neither has signaled that addressing the massive deficit would be a priority for their administration. The U.S. deficit has come within alarmingly close sight of its historical high – 106% of GDP during World War II – and is projected to continue growing at an accelerating pace.
MARKET INDICES
BLOOMBERG U.S. AGGREGATE BOND INDEX: The index consists of approximately 17,000 bonds. The index represents a wide range of securities, from investment grade and public to fixed income.
S&P 500 INDEX: S&P 500 index is a float-adjusted market-cap weighted index, largely reflecting the large-cap U.S. equities. The index includes 500 leading companies and captures approximately 80% coverage of available market capitalization.
CLIFFWATER DIRECT LENDING INDEX (CDLI): The CDLI, an index of private middle market loans launched in 2015 and reconstructed back to 2004, was created to measure private loan performance and better understand its investment characteristics. The CDLI was the first published index tracking the direct lending market and currently covers ~15,600 directly originated middle market loans totaling $337 billion.
S&P GSCI GOLD SPOT: The S&P GSCI Gold Index, a sub-index of the S&P GSCI, provides investors with a reliable and publicly available benchmark tracking the COMEX gold future. The index is designed to be tradable, readily accessible to market participants, and cost efficient to implement.
RUSSELL 2000 INDEX: A comprehensive view of small-cap performance, the Russell 2000 measures the performance of approximately 2,000 small-cap US equities.
BLOOMBERG US CORPORATE INVESTMENT GRADE INDEX: The Bloomberg US Corporate Index measures the investment grade, fixed-rate, taxable corporate bond market. It includes USD denominated securities publicly issued by US and non-US industrial, utility, and financial issuers. The index is a component of the US Credit and US Aggregate Indices, and provided the necessary inclusion rules are met, US Corporate Index securities also contribute to the multi-currency Global Aggregate Index. The index includes securities with remaining maturity of at least one year. The index was created in January 1979, with history backfilled to January 1, 1973.
BLOOMBERG US MORTGAGE-BACKED SECURITIES INDEX: The Bloomberg US Mortgage Backed Securities (MBS) Index tracks fixed-rate agency mortgage backed pass-through securities guaranteed by Ginnie Mae (GNMA), Fannie Mae (FNMA), and Freddie Mac (FHLMC). The index is constructed by grouping individual TBA-deliverable MBS pools into cohorts and then index inclusion rules are applied at the cohort level. Introduced in 1985, the GNMA, FHLMC and FNMA fixed-rate indices for 30- and 15-year securities were backfilled to January 1976, May 1977, and November 1982, respectively.
BLOOMBERG US CORPORATE HIGH YIELD INDEX: The Bloomberg US Corporate High Yield Bond Index measures the USD-denominated, high yield, fixed-rate corporate bond market. Securities are classified as high yield if the middle rating of Moody’s, Fitch and S&P is Ba1/BB+/BB+ or below. Bonds from issuers with an emerging markets country of risk, based on the indices’ EM country definition, are excluded. The US Corporate High Yield Index is a component of the US Universal and Global High Yield Indices. The index was created in 1998, with history backfilled to July 1, 1983.
RUSSELL 1000 GROWTH INDEX: The Russell 1000® Growth Index measures the performance of the large cap growth segment of the US equity universe. It includes those Russell 1000 companies with relatively higher price-to-book ratios, higher I/B/E/S forecast medium term (2 year) growth and higher sales per share historical growth (5 years). The Russell 1000® Growth Index is constructed to provide a comprehensive and unbiased barometer for the large-cap growth segment. The index is completely reconstituted annually to ensure new and growing equities are included and that the represented companies continue to reflect growth characteristics.
RUSSELL 1000 VALUE INDEX: The Russell 1000® Value Index measures the performance of the large cap value segment of the US equity universe. It includes those Russell 1000 companies with relatively lower price-to-book ratios, lower I/B/E/S forecast medium term (2 year) growth and lower sales per share historical growth (5 years). The Russell 1000® Value Index is constructed to provide a comprehensive and unbiased barometer for the large-cap value segment. The index is completely reconstituted annually to ensure new and growing equities are included and that the represented companies continue to reflect value characteristics.
MSCI AWCI EX USA INDEX: The MSCI ACWI ex USA Index captures large and mid-cap representation across 22 of 23 Developed Markets (DM) countries (excluding the US) and 24 Emerging Markets (EM) countries*. With 2,156 constituents, the index covers approximately 85% of the global equity opportunity set outside the US.
WILSHIRE LIQUID ALTERNATIVE INDEX: The Wilshire Liquid Alternative Index℠ measures the collective performance of the five Wilshire Liquid Alternative strategies that make up the Wilshire Liquid Alternative Universe. Created in 2014, with a set of time series of data beginning on December 31, 1999, the Wilshire Liquid Alternative Index (WLIQA) is designed to provide a broad measure of the liquid alternative market by combining the performance of the Wilshire Liquid Alternative Equity Hedge Index (WLIQAEH), Wilshire Liquid Alternative Global Macro Index (WLIQAGM), Wilshire Liquid Alternative Relative Value Index (WLIQARV), Wilshire Liquid Alternative Multi-Strategy Index (WLIQAMS), and Wilshire Liquid Alternative Event Driven Index (WLIQAED).
FTSE TREASURY BILL 3 MONTH INDEX: The FTSE 3 Month US T-Bill Index Series is intended to track the daily performance of 3-month US Treasury bills. The indices are designed to operate as a reference rate for a series of funds.
PERSONAL CONSUMPTION EXPENDITURES (PCE) INDEX: A measure of prices that people living in the United States, or those buying on their behalf, pay for goods and services.
COMMENTARY CONTRIBUTORS
Eric Gerster, CFA®
Chief Investment Strategist
Johann Lee, CFA®
Director of Research
Edward J. Durica, III, CFA®
Senior Wealth Advisor
Madeline Hume, CFA®
Senior Research Analyst
Juliana Guerra, MSF
Investment Research Analyst
IMPORTANT INFORMATION
This material is being provided for informational purposes only. This commentary represents the current market views of the author, and AlphaCore Capital in general, and there is no guarantee that any forecasts made will come to pass. Due to various risks and uncertainties, actual events, results or performance may differ materially from those reflected or contemplated in any forward-looking statements. The opinions are based on market conditions as of the date of publication and are subject to change. No obligation is undertaken to update any information, data or material contained herein.
Neither the information nor the opinions expressed herein constitutes an offer or solicitation to buy or sell any specific security, or to make any investment decisions. AlphaCore provides investment advice only within the context of our written advisory agreement with each AlphaCore client. Past performance is not indicative of future results. The value of an investment may be affected by a variety of factors, including eco- nomic and political developments, interest rates and foreign exchange rates, as well as issuer-specific events.
Any specific security or strategy is subject to a unique due diligence process, and not all diligence is executed in the same manner. All investments are subject to a degree of risk, and alternative investments and strategies are subject to a set of unique risks. No level of due diligence mitigates all risk, and does not eliminate market risk, failure, default, or fraud.
Any securities referenced are solely being used as an illustration of market indices due to availability of current data. This is not intended to reflect securities bought and sold by AlphaCore.
The commentary may utilize index returns, and you cannot invest directly into an index without incurring fees and expenses of investment in a security or other instrument. In addition, performance does not account for other factors that would impact actual trading, including but not limited to account fees, custody and advisory or management fees, as applicable. All of these fees and expenses would reduce the rate of return on investment.
Sources
[1] Source: Ycharts. Data as of Oct. 1, 2024. https://ycharts.com/indicators/us_pce_price_index_yoy
[2] Source: Morningstar. Data as of Oct. 1, 2024.
[3] Source: Cox, J. (2024, Sept. 19). “The Fed has set out on a ‘recalibration’ of policy. Here’s what Powell’s new buzzword means.” CNBC. https://www.cnbc.com/2024/09/19/the-fed-has-set-out-on-a-recalibration-of-policy-heres-what-powells-new-buzzword-means.html.
[4] Source: Wilding, T. (2024, Sept. 19). “Starting With a Bang: Fed Cuts Policy Rate.” PIMCO. https://www.pimco.com/us/en/insights/starting-with-a-bang-fed-cuts-policy-rate. This is not intended to express an AlphaCore position.
[5] Source: Compustat, FactSet, FTSE Russell, NBER, J.P. Morgan Asset Management. Data as of Sept. 30, 2024.
[6] Source: Factset. Data as of Sept. 27, 2024. https://advantage.factset.com/hubfs/Website/Resources%20Section/Research%20Desk/Earnings%20Insight/EarningsInsight_092724.pdf
[7] Source: Butters, J. (2024, Jun. 21) “Analysts Project S&P 500 to Report Double-Digit Earnings Growth for 2024 and 2025.” Factset. https://insight.factset.com/analysts-project-sp-500-to-report-double-digit-earnings-growth-for-2024-and-2025.
[8] Source: Morningstar. Data as of Oct. 1, 2024.
[9] Recall that when bond yields fall, bond prices rise.
[10] Source: JP Morgan Asset Management. Data as of Oct. 1, 2024.
[11] Source: Wall Street Journal. Data as of Oct. 1, 2024. https://www.wsj.com/market-data/bonds.
[12] Source: Morningstar. Data as of Oct. 1, 2024.
[13] Source: Cliffwater. Data as of Oct. 1, 2024.
[14] Source: Pitchbook. Data as of Aug. 27, 2024.
[15] Source: Morningstar. Data as of Oct. 1, 2024.
[16] Source: Reuters. Data as of Sept. 24, 2024. https://www.reuters.com/markets/asia/china-issue-284-bln-sovereign-debt-this-year-help-revive-economy-sources-say-2024-09-26/.
[17] Source: Kerr, A. (2024, Sept. 24). “China Stimulus Measures Boost Global Stocks, Commodities.” MarketWatch. https://www.marketwatch.com/story/china-stimulus-measures-boost-global-stocks-commodities-66a986ba
[18] Source: Blikre, J. (2024, Sept. 25). “What China’s Biggest Stimulus Since the Pandemic Means for US Investors: Morning Brief.” Yahoo Finance. https://finance.yahoo.com/news/what-chinas-biggest-stimulus-since-the-pandemic-means-for-us-investors-morning-brief-100039804.html. This is not intended to express an AlphaCore position.
[19] Source: New York University Stern School of Business. Data as of Oct. 3, 2024. https://pages.stern.nyu.edu/~adamodar/New_Home_Page/datafile/spearn.htm
[20] Source: Carson Group. Data as of Sept. 25, 2024. https://www.carsongroup.com/insights/blog/the-new-record-high-for-markets-is-not-a-sugar-high/