Sweet Dreams are Made of Themes
Who are we to disagree?
Summer 2024 is heating up and so too is the stock market. Continuing its ascent, the S&P 500 gained +4.3% during the quarter and +15.3% in the year-to-date (YTD) through June 30, 2024.[1] Investors bid up the market to these dream-like returns by doubling down on the defining themes that shaped first quarter results.
Last quarter, we remarked on the extreme level of concentration within the S&P 500, with approximately a third of the total value of the index tied up in seven mega-cap tech names (dubbed the “Magnificent Seven”).[2] The market has since narrowed even further, defying our expectations.
The reason for the persistence of this trend? Artificial intelligence (AI), which continues to drive outsized returns. Propelled by a slate of marvelous results in the second quarter, Nvidia alone contributed approximately 30 percentage points of the S&P 500’s total return through June 26, 2024.[3] Concentration is now at the highest level we’ve seen since the 1960s and the Magnificent Seven has whittled down to the Magnificent Five – Microsoft, Nvidia, Google, Amazon and Meta. These five names account for approximately 60% of the S&P’s return year-to-date, and now comprise more than 25% of the S&P’s total market capitalization, as seen in the chart below.[4]
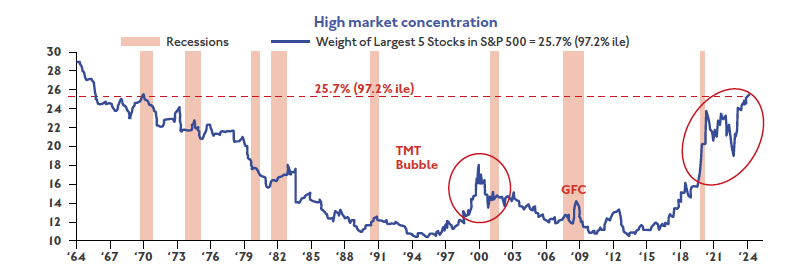
Source: J.P. Morgan. Data as of May 23rd, 2024.
Outside of AI, one other theme stands out above the rest – GLP-1 drugs – and there is a clear winner here as well: Eli Lilly. The maker of Mounjaro and Zepbound was up +16.6% for the quarter and +55.8% for the year through June 30, 2024, securing its spot as the lone healthcare name in the world’s top 10 largest companies by market cap.[5]
Of course, there is so much more to investing than what is driving the S&P 500 up or down in a given quarter. To that end, we traveled the world and the seven seas, seeking to uncover the other important developments driving markets today. Below are some of the highlights.
Everybody’s Looking for Some (Income)
On a total return basis, it was a fairly quiet quarter for traditional bonds, with the Bloomberg US Aggregate Bond index approximately flat for the quarter and down -0.7% YTD through June 30th.[6]
Within fixed income, corporate credit had a strong quarter and now looks fairly expensive on a relative value basis. This rally is reflective of a view that the economy can survive the onslaught of Fed rate hikes with a soft landing.
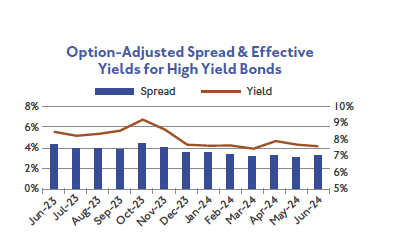
Source: FRED. Data as of July 3, 2024.[7]
Against this backdrop, nontraditional fixed income strategies have continued to shine. These actively managed strategies look beyond core bonds, scouring more esoteric pockets of the market to uncover opportunities that others might overlook. In particular, private credit strategies had another strong quarter, and the Cliffwater Direct Lending Index is currently yielding 11.7%.[8] Securitized credit, which is debt that is backed by the value of an asset, also performed well this quarter.
Even though securitized credit generally remains in good shape, real estate is at the top of our minds as we continue to observe market distress start to accelerate in the office sector. Overall delinquencies on office properties crossed 7% in June, and this quarter the market digested its first default on a AAA commercial mortgage-backed security since the global financial crisis.[9] [10]
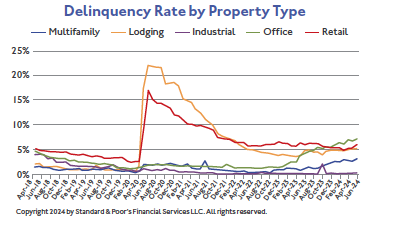
Source: S&P Global. Data as of July 1, 2024.
Taking somewhat of a contrarian stance within real estate, we ultimately believe that this distress will present opportunities. But more on that later on.
The U.S. Economy Keeps Movin’ On
Outside of isolated pockets in the real estate market, the U.S. economy remains in a solid position with signs of slowing at the margin. The latest second quarter estimate from Atlanta Fed’s GDP NowCast came in at 1.5% as of July 3, down from 3.0% just two weeks prior.[11]
These downward revisions are not cause for concern just yet – the U.S. economy still looks on track to annualize at close to 2% GDP growth by year end. Resilient consumer spending and hearty corporate fundamentals, consistent with a soft-landing scenario, have kept recession fears largely at bay. However, we continue to monitor the modest weakening in the economic data found in the labor market and consumer spending. The U.S. consumer drives nearly 70% of economic growth and is key to the soft-landing scenario.
Unemployment ticked up to 4.1% in June, passing the 4% mark for the first time since 2021. While 206,000 jobs were added during the month, slightly above expectations, the numbers for April and May were revised lower by a combined 111,000 jobs.[12] These tepid numbers likely won’t prompt any immediate action by the Fed, but the July meeting will undoubtedly be an interesting one to watch in light of these emerging cracks in the economic façade.
The directionality of these estimates serves as an important reminder for us to remain vigilant with respect to the larger macro picture even when all looks well on the surface. As another example, while American consumers remain in better health than they were prior to the pandemic, consumer balance sheets in the lower income brackets have started to shift. This has sparked an uptick in delinquencies, particularly in automative and credit cards.
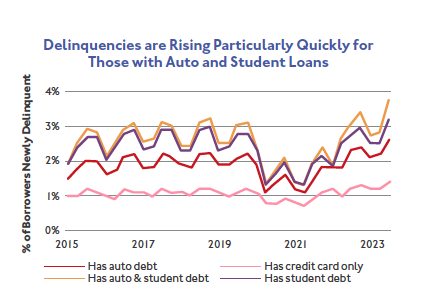
Source: BlackRock. Data as of April 2024.
For most market participants, however, this modest softening has only served to assuage fears that the economy is at risk of overheating. After a somewhat rocky start to the year, inflation data has largely turned positive this quarter. The primary components of inflation driving headline consumer price index (CPI) inflation have narrowed, from six in 2022 down to three: services, auto insurance, and shelter.
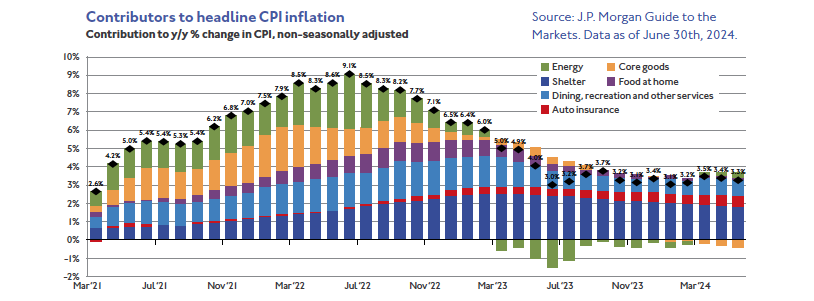 Source: J.P. Morgan Guide to the Markets. Data as of June 30th, 2024.
The burgeoning disinflationary trend has revived optimism for one or more rate cuts by the end of the year. Futures markets are pricing in the first cut in September. This may be politically tenuous given the presidential election in November, and upside risks to inflation remain, as evidenced by unexpectedly strong prints in Canada and Australia. However, there’s no doubt a rate cut would be welcomed by investors and could very well improve the market’s breadth.
Keep Your Head Up
Even so, a rate cut isn’t necessary in order to preserve forward progress. It bears repeating that 8 out of the 11 sectors of the S&P delivered positive earnings growth in the first quarter, and we still expect to see a broadening trend gain steam as the year goes on. Consensus suggests that the anticipated 31% gap in earnings between the Magnificent 5 and the median S&P firm forecasted for 2024 is expected to narrow to 8% by 2025.[13]
We suspect this shift will be triggered by investors following themes such as AI and GLP-1 to their second-order effects, and we are working to ensure our equity solutions provide adequate diversification while poised to capture the key themes driving the growth of this asset class today. Our stock selection process focuses on identifying companies generating strong cash flow and high return on invested capital that are trading at reasonable prices. As we pursue opportunities, we recognize that with high expectations already built in, it will be difficult for stocks to match their previous strength going forward.
With future upside to equity markets likely dependent on better earnings growth outside the largest companies in the U.S., we continue to believe diversification into alternatives represent a prudent way to construct portfolios. Our research continues to focus on multiple solutions across the alternatives spectrum that seek to enhance returns and lower volatility.
In credit, we believe the private markets present some of the best opportunities today. Commercial real estate credit specifically offers compelling prospects for intrepid investors willing to take a long-term view. We discussed office earlier, but we expect that the impact of high rates will not stay contained to office for long; properties across commercial real estate with debt financed prior to 2022 could start to stumble as their loans come due over the next several years. We anticipate this will create an influx of properties with otherwise sterling fundamentals where the original owner is simply unable to bear the refinancing costs given higher interest rates.
On the alternatives side, we continue to favor multi-strategy hedge funds, which have performed exactly as expected – the HFRI Macro Multi-Strategy Index, which tracks the performance of these funds, is currently up +4.1% YTD through May 2024, and on track to annualize to high-single digits by the end of the year while curtailing overall portfolio volatility.[14]Although many other alternative strategies have delivered slightly more muted performance this year, especially when compared to equities, we believe they still have a place in a well-rounded portfolio.
Above all else, our goal as allocators is for our clients to be able to sleep well at night and have sweet dreams, as opposed to nightmares running through their financial anxieties. We strive to deliver this peace of mind even during times of uncertainty. We may be sailing through relatively calm waters now but recognize things could get a lot choppier as we head into the fall and election season. Thus, our conviction in a diversified, disciplined approach to portfolio construction remains strong as ever. If you have any questions or concerns, please do not hesitate to reach out.
Appendix: A few charts we found during the quarter that you may find interesting…
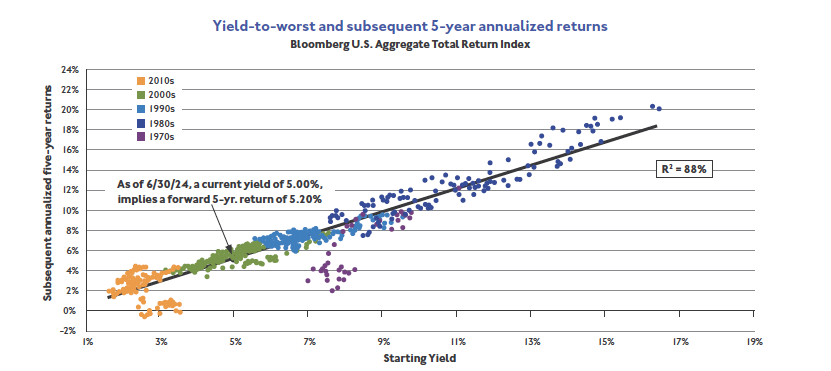
A relationship that we’re spending a lot of time thinking about:
In traditional fixed income, yield currently hovers around 5%. This is a very strong indicator of the go-forward returns that investors can realize in bonds.
Source: J.P. Morgan Guide to the Markets. Data as of June 30th, 2024.
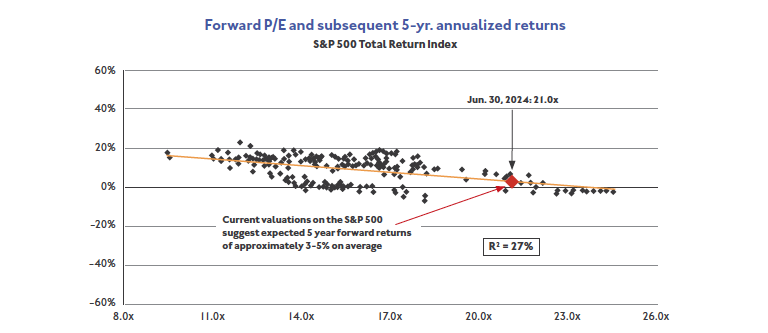
Meanwhile, an inverted relationship is starting to unfold in stocks. While the outlook is still positive today, it will start to turn more bearish if forward P/Es continue to rise much further. In layman’s terms, if you pay more for an asset today, it will be harder to sell it for a profit in the future.
Source: J.P. Morgan Guide to the Markets. Data as of June 30th, 2024.
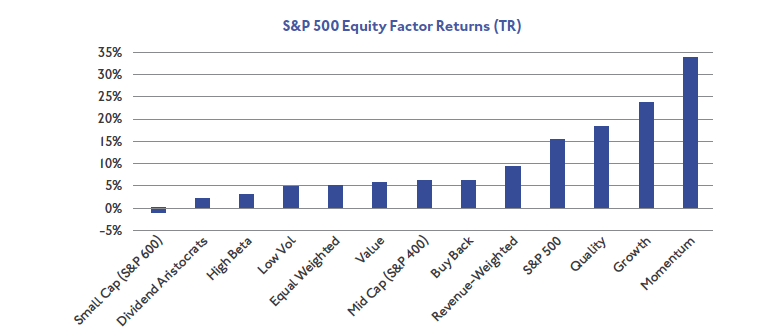
Part of the reason equities are looking more expensive is because investors are still chasing sweet dreams of future outperformance by pouring money into momentum trades – a trading strategy that seeks to capitalize on directional trends in a stock’s price. It has returned more than 30% YTD.
Source: Morningstar. Data as of July 3, 2024.
Sparks were flying outside the equity markets too. By comparing the air quality pre- and post-4th of July, we can see who went all out with the pyrotechnics over the holiday.

Source: X (Formerly Twitter). Data as of July 5, 2024.
If the fireworks make you think about all the emergency room trips they cause, you’re in good company. Here are some other activities that could land your kid in the hospital.
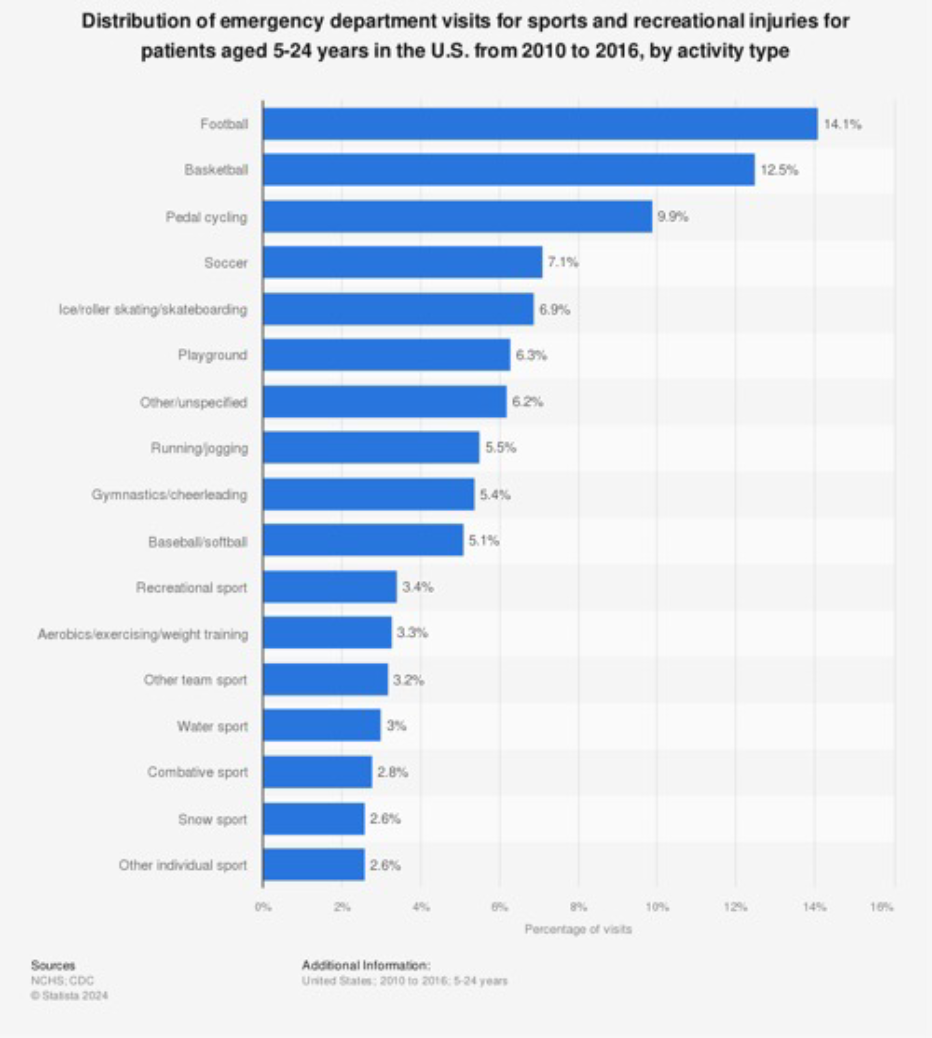
Source: Statista. Data as of July 3, 2024.
Market Indices:
- BLOOMBERG BARCLAYS CAPITAL U.S. AGGREGATE BOND INDEX: The index consists of approximately 17,000 bonds. The index represents a wide range of securities, from investment grade and public to fixed income.
- S&P 500 INDEX: S&P 500 index is a float-adjusted market-cap weighted index, largely reflecting the large-cap U.S. equities. The index includes 500 leading companies and captures approximately 80% coverage of available market capitalization.
- ICE BOAML HY INDEX: The index is a commonly used benchmark index for high yield corporate bonds. It tracks the performance of U.S. dollar denominated below investment grade rated corporate debt publicly issued in the U.S. domestic market.
- CLIFFWATER DIRECT LENDING INDEX (CDLI): The CDLI, an index of private middle market loans launched in 2015 and reconstructed back to 2004, was created to measure private loan performance and better understand its investment characteristics. The CDLI was the first published index tracking the direct lending market and currently covers ~15,600 directly originated middle market loans totaling $337 billion.
- CONSUMER PRICE INDEX (CPI): The Consumer Price Index (CPI) is a measure of the average change over time in the prices paid by urban consumers for a market basket of consumer goods and services. •
- HFRI MACRO MULT STRATEGY INDEX: Macro: Multi-Strategy Strategies which employ components of both Discretionary and Systematic Macro strategies, but neither exclusively both. Strategies frequently contain proprietary trading influences, and in some cases contain distinct, identifiable sub-strategies, such as equity hedge or equity market neutral, or in some cases a number of sub-strategies are blended together without the capacity for portfolio level disaggregation. Strategies employ an investment process is predicated on a systematic, quantitative evaluation of macroeconomic variables in which the portfolio positioning is predicated on convergence of differentials between markets, not necessarily highly correlated with each other, but currently diverging from their historical levels of correlation. Strategies focus on fundamental relationships across geographic areas of focus both inter and intra-asset classes, and typical holding periods are longer than trend following or discretionary strategies.
IMPORTANT INFORMATION
This material is being provided for informational purposes only. This commentary represents the current market views of the author, and AlphaCore Capital in general, and there is no guarantee that any forecasts made will come to pass. Due to various risks and uncertainties, actual events, results or performance may differ materially from those reflected or contemplated in any forward-looking statements. The opinions are based on market conditions as of the date of publication and are subject to change. No obligation is undertaken to update any information, data or material contained herein.
Neither the information nor the opinions expressed herein constitutes an offer or solicitation to buy or sell any specific security, or to make any investment decisions. AlphaCore provides investment advice only within the context of our written advisory agreement with each AlphaCore client. Past performance is not indicative of future results. The value of an investment may be affected by a variety of factors, including eco- nomic and political developments, interest rates and foreign exchange rates, as well as issuer-specific events.
Any specific security or strategy is subject to a unique due diligence process, and not all diligence is executed in the same manner. All investments are subject to a degree of risk, and alternative investments and strategies are subject to a set of unique risks. No level of due diligence mitigates all risk, and does not eliminate market risk, failure, default, or fraud.
Any securities referenced are solely being used as an illustration of market indices due to availability of current data. This is not intended to reflect securities bought and sold by AlphaCore.
The commentary may utilize index returns, and you cannot invest directly into an index without incurring fees and expenses of investment in a security or other instrument. In addition, performance does not account for other factors that would impact actual trading, including but not limited to account fees, custody and advisory or management fees, as applicable. All of these fees and expenses would reduce the rate of return on investment
If you are interested in how AlphaCore Wealth Advisory can help you reach your investment goals, please do not hesitate to contact us.
Download Commentary
Commentary Contributors:
Eric Gerster, CFA®
Chief Investment Strategist
egerster@alphacore.com
Johann Lee, CFA®
Director of Research
jlee@alphacore.com
Edward J. Durica, III, CFA®
Senior Wealth Advisor
edurica@alphacore.com
Madeline Hume, CFA®
Senior Research Analyst
mhume@alphacore.com
Juliana Guerra, MSF
Investment Research Analyst
jguerra@alphacore.com
Sources
[1] Morningstar. Data as of July 3, 2024.
[2] Aptus Capital Advisors. https://aptuscapitaladvisors.com/aptus-musings-can-the-sp-500-win-if-the-mag-7-loses/
[3] Langley, K. (2024, June 28). “AI Frenzy Propels Stocks to Monster First Half.” The Wall Street Journal. https://www.wsj.com/finance/stocks/ai-frenzy-propels-stocks-to-monster-first-half-620229cc.This is not intended to illustrate an AlphaCore position.
[4] Kostin, D. (2024, June 14). “US Weekly Kickstart.” Goldman Sachs These are not intended to illustrate an AlphaCore positions.
[5] Morningstar. Data as of July 3, 2024. This is not intended to illustrate an AlphaCore position.
[6] Morningstar. Data as of July 3, 2024.
[7] The option adjusted spread is the measurement of the premium of a fixed-income security to a comparable point on the spot Treasury curve, taking into account the impact of any embedded options on that fixed income security’s price.
[8] Cliffwater. Data as of March 31, 2024.
[9] S&P Global. https://www.spglobal.com/ratings/en/research/articles/240701-sf-credit-brief-u-s-cmbs-delinquency-rate-rose-22-bps-to-4-8-in-june-2024-updates-provided-on-modification-13165993
[10] Arroyo, C. and Wong, N. (2024, May 23). “Losses Pile Up in Top-Rated Bonds Backed by Commercial Real Estate Debt.” Bloomberg. https://www.bloomberg.com/news/articles/2024-05-23/cmbs-buyers-suffer-first-loss-on-aaa-debt-since-financial-crisis.
[11] Atlanta Federal Reserve. https://www.atlantafed.org/cqer/research/gdpnow
[12] Lahart, J. (2024, July 5). “U.S. Added 206,000 Jobs in June as Hiring Stays Strong.” The Wall Street Journal. https://www.wsj.com/economy/jobs/jobs-report-june-unemployment-economy-68275d9e
[13] Kostin, D. (2024, June 14). “US Weekly Kickstart.” Goldman Sachs.
[14] Hedge Fund Research. Data as of July 8, 2024.
