Q2 2025 Commentary: Same As It Ever Was
Same As It Ever Was
The more things change, the more things stay the same.
Letting the Days Go By
As summer begins to seep into our collective consciousness, here at AlphaCore our eyes are already turning to the fall and the return of our third annual Wealth Summit. This year’s theme is “Back To the Future,” which has us thinking about the eighties in all kinds of ways. Reflecting on the second quarter, one song that feels particularly relevant is “Same As It Ever Was,” by the Talking Heads.
The parallels seem obvious: This year has been super steady-eddy, hasn’t it? Kidding – mostly. Surprisingly, most of the major asset classes have done exactly what we would expect them to do at this point in the calendar year, if not better.
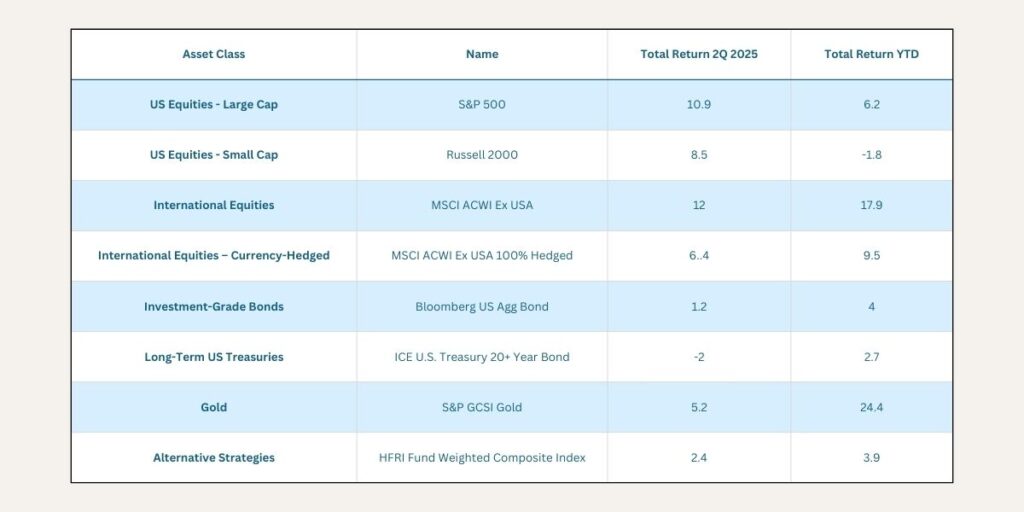
Source: Morningstar, HFRI. Data as of July 8, 2025.
- US Equities Chug Along: Amazingly, the S&P 500 has already recouped all of its post-Liberation day losses and is now back on track for another solid year. As of June 30, the S&P 500 closed at $6,205, surpassing its previous all-time peak of $6,144 set on February 19, 2025.[1]
- Stocks are also expensive again. The forward 12-month price-to-earnings (P/E) ratio for the S&P 500 is 22.0x— a metric only previously reached during the 2021 meme stock frenzy and the 2000s tech boom.[2]
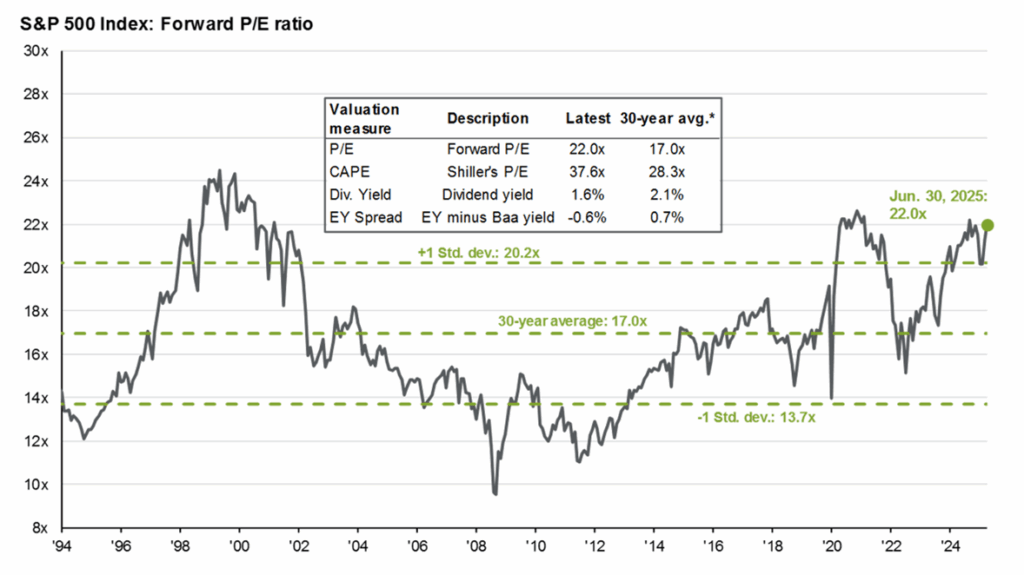
Source: Guide to the Markets – U.S. Data are as of June 30, 2025.[3]
- Bond Markets Clip Coupons: Also somewhat unexpectedly, a buy-and-hold approach in Treasuries at the 10-year part of the curve made money over the last year – mostly from income but also some price appreciation. That’s because the U.S. 10 Year is currently trading at a 4.2% yield; very close to where it was trading a year ago, at 4.4%.[4] (When the yield on a bond falls, its price rises.)
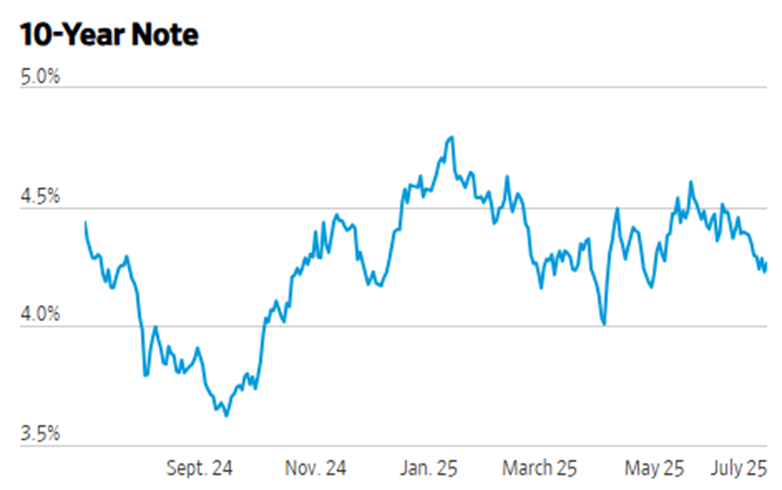
Source: Wall Street Journal. Data as of July 1, 2025.
The Bloomberg Aggregate Index has also performed well, returning 4.0% so far this year, a comfortable margin ahead of its SEC yield of 4.6% at year-end 2024.[5] (Current yields tend to be a strong predictor of future total returns.)
- Geopolitical Events Fail to Make a Dent: Since we finished our last commentary on April 12, the U.S. has entered into a geopolitical conflict with Iran. This news sent shockwaves through the energy markets, with Brent Crude (which is used to price the majority of the world’s internationally traded crude oil[6]) spiking to $76.92 on June 20. However, the spike quickly faded as tensions eased, and the contract is now trading at $66.74 as of month-end.[7]
Reading these summaries, you may find yourself asking, just as David Byrne did, “How did we get here?” Because it’s certainly felt like a bumpy ride. Indeed there have been some changes underneath the surface, as each market environment presents some fresh new dynamics to examine. We would call out two to your attention:
- International Markets Reverse the Tide: The most unusual facet of our current environment is the outperformance of ex-U.S. equities. The MSCI ACWI ex-USA Index has returned 17.9% year-to-date, compared to the 6.2% of the S&P. However, it’s important to note that the relative weakness of the U.S. dollar accounts for almost half of this return; the hedged version of the MSCI ACWI Index, which adjusts for currency fluctuations, was up 9.5%—still outperforming the U.S., but by a much slimmer margin.[8]
- Dollar Fizzles: How could that swing be so dramatic? Well, the DXY (an index that tracks the relative strength of the dollar against a basket of select currencies) has declined 11.9% since its January 14 peak.[9] That’s the largest YTD decline for the dollar since the dissolution of the Bretton-Woods system in 1973. But because the dollar has been so strong lately, this downdraft has brought the currency back to levels last seen just three years ago, in 2022.
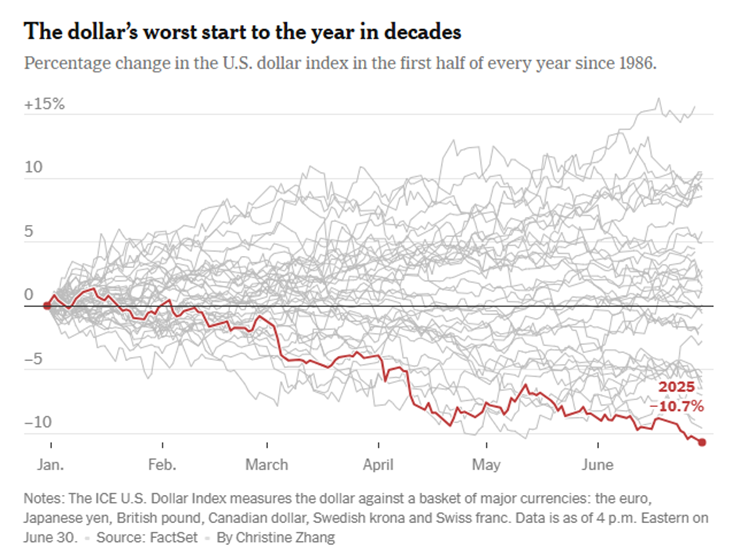
Source: Factset, New York Times. Data as of June 30, 2025.
During this tariff episode, the market has taken refuge in other assets instead. Gold has continued its incredible run, and bitcoin has taken off on a rally of its own, returning a stunning 29.9% during the quarter.[9]
Water Flowing Underground
While we see a lot of froth on the surface of the markets, the Talking Heads also remind us that there’s currents underground as well, silently shaping our investable opportunity set. We see several critical currents that are worth watching today.
- Tariffs Are Likely To Be Punitive, But Effects Aren’t Evident Yet: The most pressing issue facing the U.S. economy today is tariffs. Although the market frenzy around the initial April 2nd announcements has subsided, the United States’ current effective tariff rate of 14.1% (after accounting for the substitution of goods imported from China) still ranks as the highest levy in effect since 1938.[10] Notably, we are only just starting to see the impact of tariffs on supply chain data, and it will take much more time for the tariffs to really bite. We believe this is part of why equity markets have remained fairly sanguine.
- Tariffs underscore that from a geopolitical perspective, our world is slowly turning away from globalization as an ideal. While this fragmentation theme introduces a lot of volatility into markets, it also presents opportunities for active management.
- Economy Remains Resilient: In the absence of evidence that tariffs have damaged the consumer’s position, the hard data that we do have points to an economy that continues to chug along. Forecasters estimate a 1.5% growth rate for the second quarter – not as healthy as it might have been, but still a strong print.[11] Headline unemployment also remains well within bounds at 4.1%.[12]
- Deficit Concerns Continue to Build, but Remain Contained: The bond markets have been abuzz with speculation over the fiscal deficit. While investors might conclude that fears over the U.S. government’s ability to pay its debt would naturally increase the borrowing rate for that debt, so far interest rates haven’t moved much in response – perhaps as a function of the relative spread of U.S. rates to the rest of the world. We’ve really only seen that fear expressed at the long end of the curve – for bonds with maturities of 20 years or more.
- A Secular Theme Emerging in AI: Meanwhile, excitement for the potential of AI continues apace, and in the second quarter launched into a full-scale talent brawl. Meta, for instance, allegedly has offered as much as $100 million on pay packages to poach key executives.[13] All of this expected compute will demand a fantastic amount of power as well. According to CBRE, average asking rates for 250-to-500-kW deployments rose 13% in 2024, reflecting sustained demand and limited availability.[14]
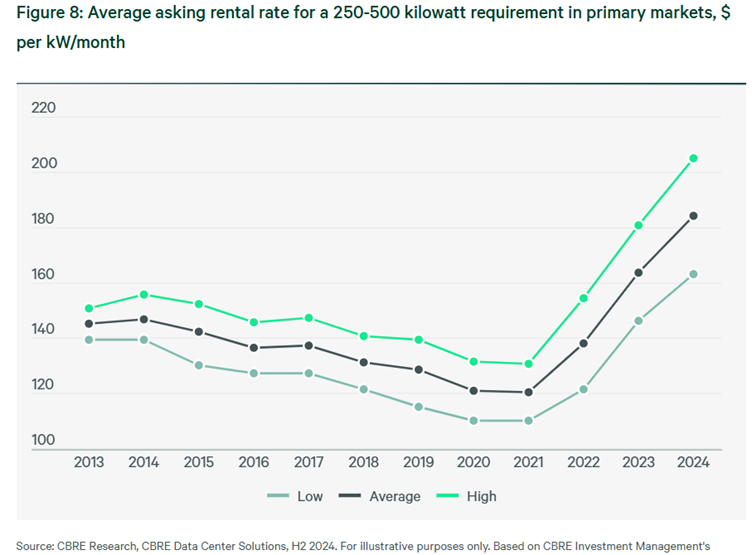
Source: CBRE. Data as of June 24, 2025.
Where is That Large Automobile?
In the near-term—likely as early as this summer—tariffs are going to make their presence felt. For instance, here in the U.S. we leverage imported rare earth magnets from China in everything from cars to jet fighters. As the U.S. continues to home in on China as a key trade adversary, it’s critical to remember that goods such as rare earth metals cannot be substituted right away. This is one key illustration of why 2025 is shaping up to be fairly tepid from an economic perspective.
So why, then, are stocks still so richly valued? Well, markets are forward-looking. Much about 2026 indicates that it could be a very strong calendar year; stimulus from the One Big Beautiful Bill that just passed into law, the potential impacts of deregulation, stronger EPS growth from fading of tariff effects, and U.S. multinational companies benefiting from weaker dollar, could all support sustained growth. When you bundle all that up with the optimism around AI, there are enough tailwinds to justify current valuations – for now.
Over the longer term, though, we expect that high starting valuations will weigh on U.S. equity returns. Just look back over the 15 years from 2009-2024: if you contrast the various sources of return in equities – which include dividend yields, compounding of earnings, and multiple expansion – the largest contributor during that window was multiple expansion. Put another way, stocks went up because they got more expensive. This cycle is simply not repeatable, unless you believe that the market can bear a 35x price-to-earnings ratio.
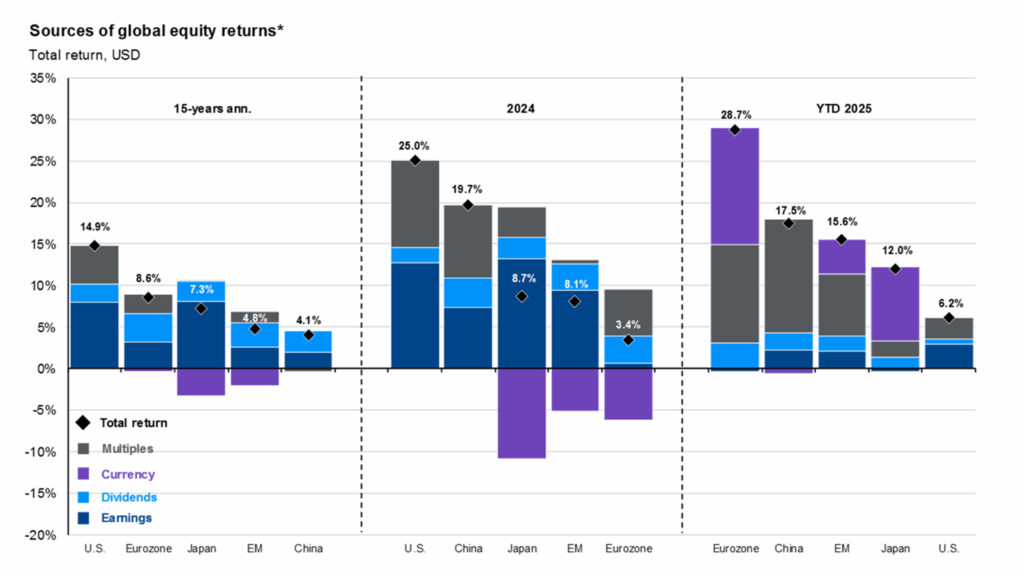
Source: Guide to the Markets – U.S. Data as of June 30, 2025.[15]
On the debt side of the balance sheet, although markets have grown more skeptical of the U.S.’s creditworthiness, we believe that the U.S. Dollar will retain its reserve currency status given its pervasiveness as a pricing instrument in financial markets worldwide.
However, reserve currency status does not guarantee a premium valuation. We expect that central banks will continue to diversify their reserves at the expense of U.S. Treasuries and other dollar-denominated assets, which suggest that dollar weakness may continue. (The dollar was probably ripe for a correction anyway, due to how overvalued it was previously.)
Investors no longer can overlook the impacts of currencies on their returns, if they ever did. This mega-trend also supports an ongoing allocation to scarce assets, such as gold.
Once In a Lifetime
As we assess the resilience of the economy, we continue to watch retail spending, which was flat in April and down in May as the tariffs took effect. We’re also watching recurring jobless claims, which have been elevated recently, and tend to be a good leading indicator of softening payroll growth. On a go-forward basis, we are following the latest tariff announcements, though at this point the market seems to believe that most effective tariff rates are close to finalized and all changes are mostly open to negotiation. Finally, we’re keeping tabs on the latest advancements in AI for evidence of improved productivity.
Source: Ernie Tedeschi, Director of Economics at The Budget Lab, via X. Data as of June 26, 2025.
As we recalibrate our portfolios for this new regime, we have done a few key things.
- Reaffirm our commitment to globally diversified stock exposure, and keep international equity exposure unhedged, which should be a tailwind if the dollar continues to weaken.
- Remain selective within credit, and seek highly hedged strategies that allow us to expand our fixed income allocations across sectors and countries while reducing sensitivity to undesirable rate volatility.
- Diversify into infrastructure solutions that benefit from current structural tailwinds around power development and AI while providing a non-correlated return stream vs. stocks and bonds.
- Finally, we continue to utilize diversifiers such as multi-strategy hedge funds, which are uncorrelated to traditional assets.
We may be in the thick of the summer doldrums now, but things could get a lot choppier as tariffs begin to crop up in the economic data. When markets get rocky, the always-critical principle of diversification helps to curb volatility and help people stay invested. We saw the benefits of this relationship play out in April when the market did sell off. Unsurprisingly, our conviction in a systematic approach to diversification remains robust.
Our goal as allocators is to help to deliver peace of mind even during times of uncertainty, and to offer unique insights directly from the experts themselves. We invite you to get “Back to the Future” this fall at our Wealth Summit to cover our outlook across crucial topics that we’ve discussed in this commentary – the economy, markets, and underlying drivers such as artificial intelligence. We hope that events such as these can help our clients spend less time listening to talking heads, and more time listening to the Talking Heads.
If you have any questions, please do not hesitate to reach out!
Charts We Loved This Quarter
- All-time highs are usually cause for consternation among investors. Though they can be a useful trigger to rebalance back to target, they are not necessarily very predictive of future returns.
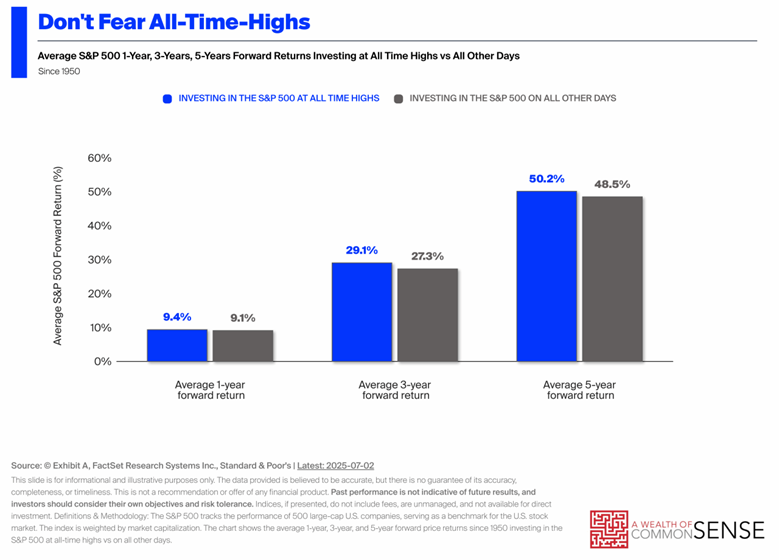
Source: A Wealth of Common Sense. Data as of July 4, 2025.
- Meanwhile in fixed income, a good reminder that bonds are now out of the multi-decade bull market that propelled the 60/40 for much of the last 45 year period.
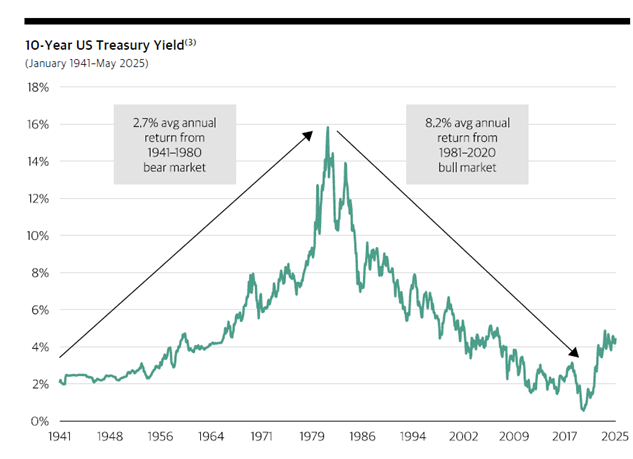
Source: Blackstone. Data as of June 24, 2025.
- An illustration of the impact of the dollar’s recent retreat, bringing the DXY back to mid-2022 levels.
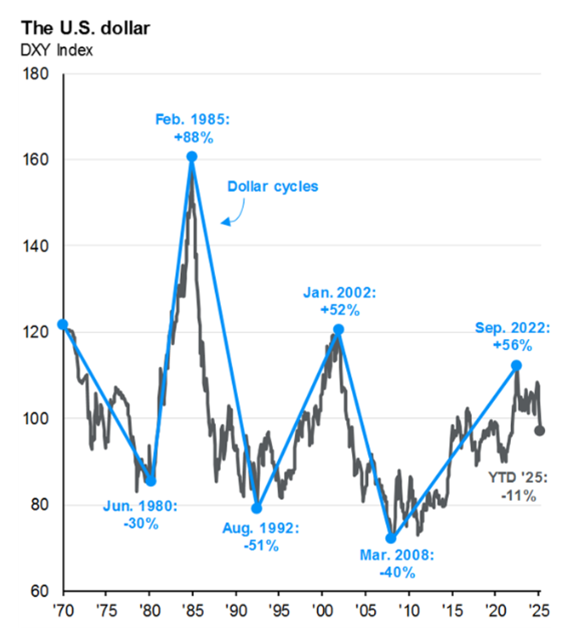
Source: Guide to the Markets. Data as of June 30, 2025.
- Central bank flows are one of the reasons that the dollar has depreciated. Many central banks have been reducing their dollar reserves and reallocating towards gold:
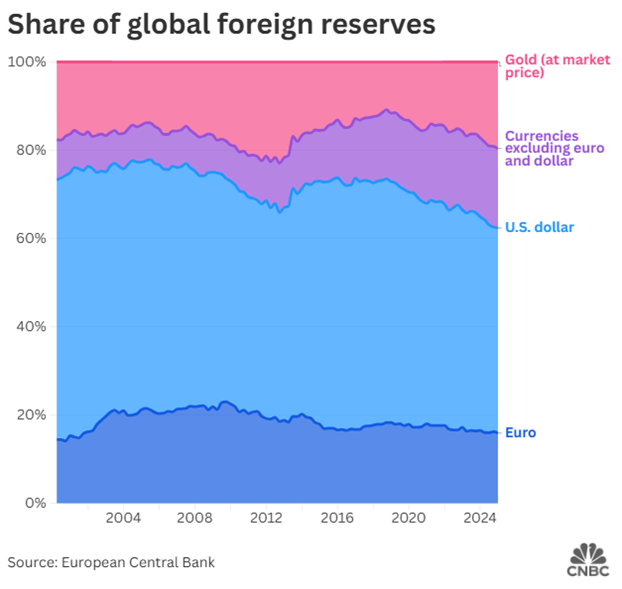
Source: CNBC. Data as of June 11, 2025.
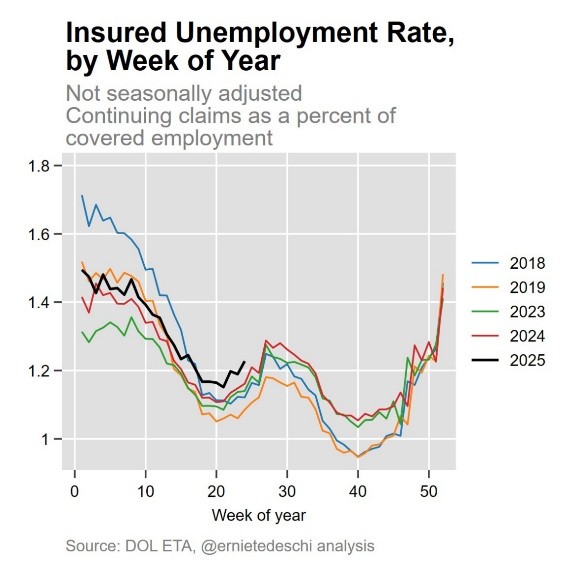
- Historically speaking, it’s quite unusual to see what amounts to a flat unemployment rate, as illustrated in the 2024-2025 period shown below.
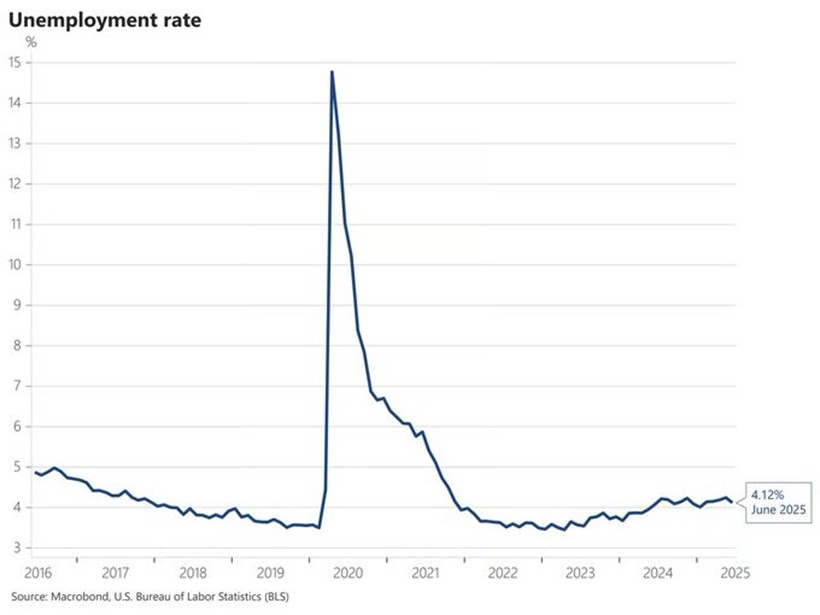
Source: Nick Timiraos, Chief Economics Correspondent of the WSJ, via X. Data as of July 3, 2025.
- Healthcare has been a big part of that employment story. It has subsumed manufacturing as the top industry in most states.
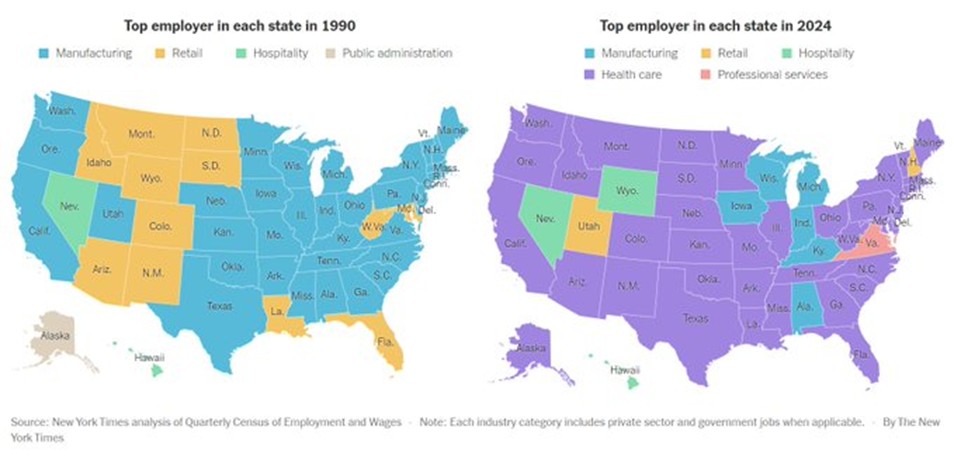
Source: New York Times. Data as of July 3, 2025.
- While we’re looking at maps, this one compares how much people like summer based on where they live in the U.S. Michiganders just barely beat out Alaskans as the residents who love summer the most.
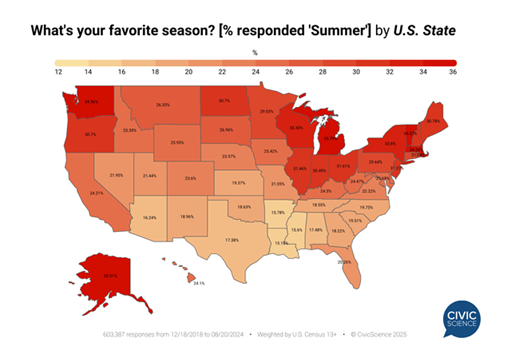
Source: CivicScience via Reddit. Data as of August 20, 2024.
- But while many people enjoy spending their summers close to home, international travel has gotten more popular than ever.
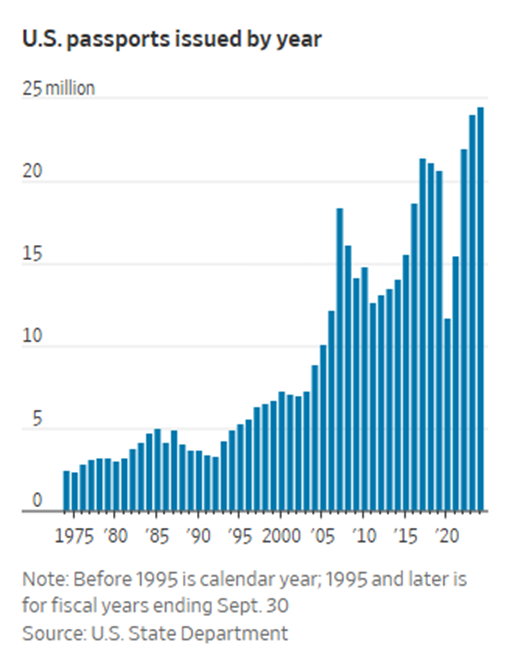
Source: The Wall Street Journal. Data as of July 4, 2025.
- Foreign travel to the U.S., on the other hand, has declined. But this shortfall has been partially offset by increased domestic travel.
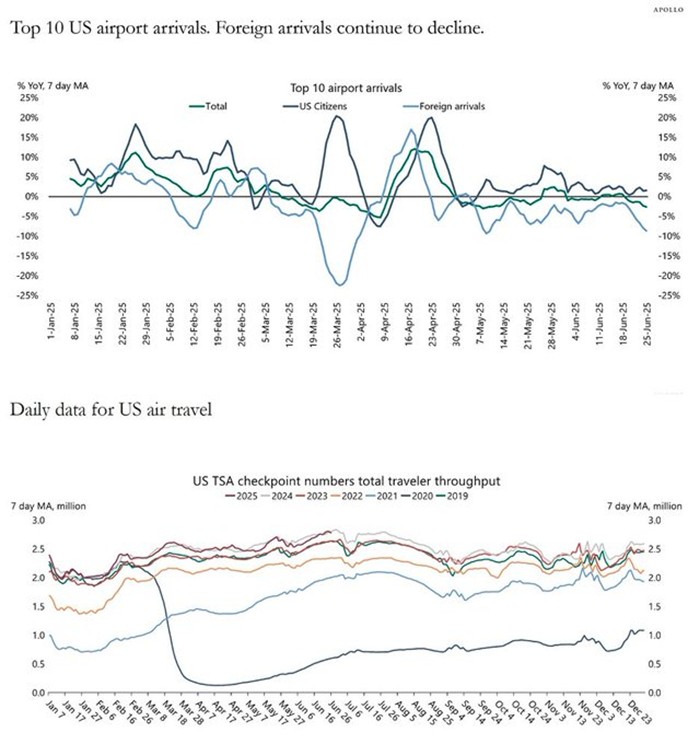
Source: U.S. Department of Homeland Security, Macrobond, Apollo Chief Economist. Data as of July 1, 2025.
- Finally, the start of July means the beginning of the Wimbledon tennis tournament, which offers the potential for a rematch of the French Open final between Jannik Sinner and Carlos Alcaraz. Both players are making a splash on the tennis tour, as shown below.
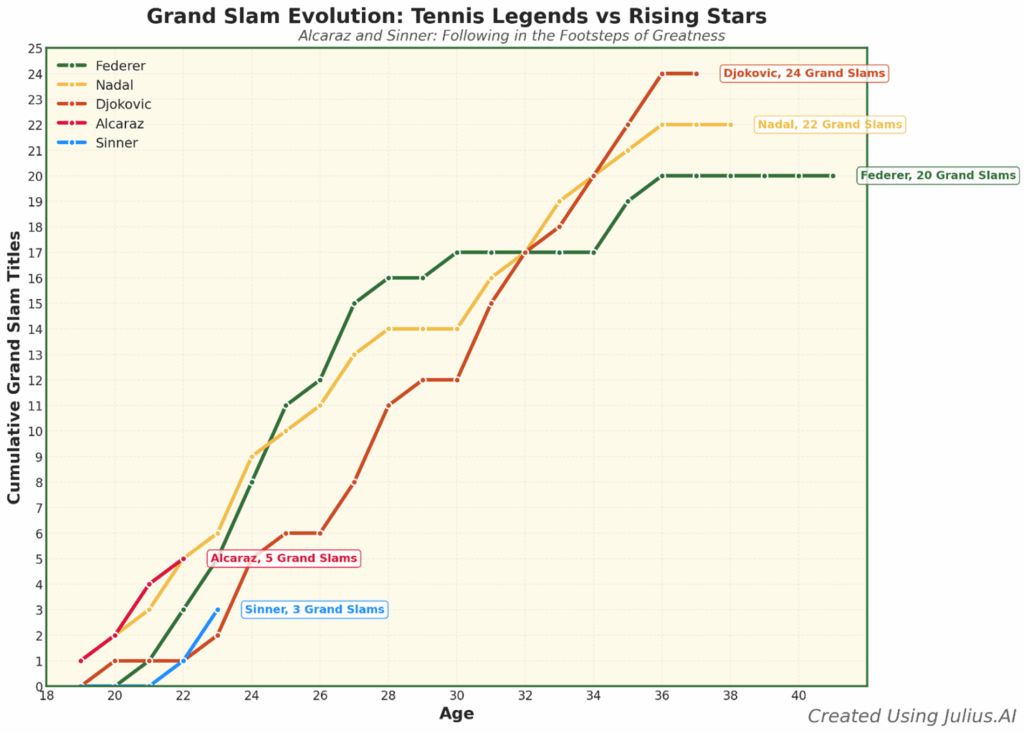
Source: Guide to the Markets. Data as of June 30, 2025.
Market Indices
S&P 500 INDEX: S&P 500 index is a float-adjusted market-cap weighted index, largely reflecting the large-cap U.S. equities. The index includes 500 leading companies and captures approximately 80% coverage of available market capitalization.
RUSSELL 2000 INDEX: A comprehensive view of small-cap performance, the Russell 2000 measures the performance of approximately 2,000 small-cap US equities.
RUSSELL 1000 GROWTH INDEX: The Russell 1000® Growth Index measures the performance of the large cap growth segment of the US equity universe. It includes those Russell 1000 companies with relatively higher price-to-book ratios, higher I/B/E/S forecast medium term (2 year) growth and higher sales per share historical growth (5 years). The Russell 1000® Growth Index is constructed to provide a comprehensive and unbiased barometer for the large-cap growth segment. The index is completely reconstituted annually to ensure new and growing equities are included and that the represented companies continue to reflect growth characteristics.
RUSSELL 1000 VALUE INDEX: The Russell 1000® Value Index measures the performance of the large cap value segment of the US equity universe. It includes those Russell 1000 companies with relatively lower price-to-book ratios, lower I/B/E/S forecast medium term (2 year) growth and lower sales per share historical growth (5 years). The Russell 1000® Value Index is constructed to provide a comprehensive and unbiased barometer for the large-cap value segment. The index is completely reconstituted annually to ensure new and growing equities are included and that the represented companies continue to reflect value characteristics.
MSCI AWCI EX USA INDEX: The MSCI ACWI ex USA Index captures large and mid-cap representation across 22 of 23 Developed Markets (DM) countries (excluding the US) and 24 Emerging Markets (EM) countries*. With 2,156 constituents, the index covers approximately 85% of the global equity opportunity set outside the US.
MSCI ACWI EX USA US DOLLAR HEDGED: The MSCI ACWI ex USA US Dollar Hedged Index represents a close estimation of the performance that can be achieved by hedging the currency exposures of its parent index, the MSCI ACWI ex USA Index, to the USD, the “home” currency for the hedged index. The index is 100% hedged to the USD by selling each foreign currency forward at the one-month Forward rate. The parent index is composed of large and mid-cap stocks across 22 Developed Markets (DM) countries and 24 Emerging Markets (EM) countries.
BLOOMBERG U.S. AGGREGATE BOND INDEX: The index consists of approximately 17,000 bonds. The index represents a wide range of securities, from investment grade and public to fixed income.
ICE U.S. TREASURY 20+ YEAR BOND INDEX: ICE U.S. Treasury 20+ Year Bond Index tracks the performance of US dollar denominated sovereign debt publicly issued by the US government in its domestic market. Qualifying securities must have greater than or equal to twenty years remaining term to final maturity as of the rebalancing date, a fixed coupon schedule and an adjusted amount outstanding of at least $300 million. The amount outstanding for all qualifying securities is adjusted to reduce by the amounts held by the Federal Reserve’s SOMA account. Bills, inflation-linked debt, original issue zero coupon securities and STRIPs are excluded from the Index; however, the amounts outstanding of qualifying coupon securities are not reduced by any portions that have been stripped. Agency debt with or without a US Government guarantee and securities issued or marketed primarily to retail investors do not qualify for inclusion in the index.
PERSONAL CONSUMPTION EXPENDITURES (PCE) INDEX: A measure of prices that people living in the United States, or those buying on their behalf, pay for goods and services.
U.S. DOLLAR INDEX (“DXY”): The U.S. Dollar Index (USDX, DXY, DX, or, informally, the “Dixie”) is an index (or measure) of the value of the United States dollar relative to a basket of foreign currencies, often referred to as a basket of U.S. trade partners’ currencies. The Index goes up when the U.S. dollar gains “strength” (value) when compared to other currencies.
HFRI FUND WEIGHTED COMPOSITE INDEX: The HFRI Fund Weighted Composite Index is a global, equal-weighted index of single-manager funds that report to HFR Database. Constituent funds report monthly net of all fees performance in U.S. Dollar and have a minimum of $50 Million under management or a twelve (12) month track record of active performance. The HFRI Fund Weighted Composite Index does not include Funds of Hedge Funds.
COMMENTARY CONTRIBUTORS
Eric Gerster, CFA®
Chief Investment Strategist
Johann Lee, CFA®
Director of Research
Edward J. Durica, III, CFA®
Senior Wealth Advisor
Madeline Hume, CFA®
Senior Research Analyst
IMPORTANT INFORMATION
AlphaCore is a registered investment adviser. Registration does not imply a certain level of skill or training. Information presented is for educational purposes only and does not intend to make an offer or solicitation for the sale or purchase of any specific securities, investments, or investment strategies. Investments involve risk and, unless otherwise stated, are not guaranteed. Be sure to first consult with a qualified financial adviser and/or tax professional before implementing any strategy discussed herein. Past performance is not indicative of future performance.
The opinions expressed herein are as of the date of publication and are subject to change due to changes in the market or economic conditions, and may not necessarily come to pass.
SOURCES:
__________________________________________________________
[1] Source: Koyfin. Data as of June 30, 2025.
[2] Source: FactSet, FRB, Refinitiv Datastream, Robert Shiller, Standard & Poor’s, Thomson Reuters, J.P. Morgan Asset Management. Data as of June 30, 2025.
[3] Sources: Bloomberg, FactSet, Moody’s, Refinitiv Datastream, Robert Shiller, Standard & Poor’s, J.P. Morgan Asset Management. Forward P/E ratio is the most recent S&P 500 index price divided by consensus analyst estimates for earnings in the next 12 months, provided by IBES since March 1994 and FactSet since January 2022. Shiller’s P/E uses trailing 10-years of inflation-adjusted earnings as reported by companies. Dividend yield is calculated as consensus estimates of dividends in the next 12 months, provided by FactSet, divided by the most recent S&P 500 index price. EY minus Baa yield is the forward earnings yield (the inverse of the forward P/E ratio) minus the Bloomberg U.S. corporate Baa yield since December 2008 and interpolated using the Moody’s Baa seasoned corporate bond yield for values beforehand. *Average for dividend yield is since August 1995 due to data availability.
[4] Source: Wall Street Journal. Data as of July 1, 2025.
[5] Source: Morningstar Direct. Data as of July 1, 2025.
[6] Source: Intercontinental Exchange.
[7] Source: Koyfin. Data as of July 1, 2025.
[8] Source: Morningstar Direct. Data as of July 1, 2025.
[9] Source: Morningstar Direct. Data as of July 1, 2025. Currencies in the DXY Index are: British pound, Canadian dollar, euro, Japanese yen, Swedish krona and Swiss franc.
[10] Source: Morningstar Direct. Data as of July 1, 2025.
[11] Source: Budget Lab. Data as of July 7, 2025.
[12] Source: Federal Reserve Bank of Philadelphia Second Quarter 2025 Survey of Professional Forecasters. Data as of May 16, 2025.
[13] Source: Source: U.S. Bureau of Labor Statistics via FRED®. Data as of July 3, 2025.
[14] Source: Urbano, Brunella Tipismana. “Sam Altman Says Meta Offered OpenAI Staffers $100 Million Bonuses.” Bloomberg. June 17, 2025.
[15] Source: CBRE Infrastructure Quarterly. Data as of June 24, 2025.
[16] Source: Underlying Sources: FactSet, MSCI, Standard & Poor’s, J.P. Morgan Asset Management. 15-years ann. is a rolling 15-year period ending with the previous month-end. All return values are MSCI Gross Index data, except the U.S., which is the S&P 500. *Multiple expansion is based on the forward P/E ratio, and EPS growth outlook is based on NTMA earnings estimates. Chart is for illustrative purposes only. Past performance is not indicative of future results.
This material is being provided for informational purposes only. This material represents the current views and opinions of AlphaCore Capital, and there is no guarantee that any opinions will prove to be accurate, or any forecasts made will come to pass. No obligation is undertaken to update any information, data or material contained herein. AlphaCore provides investment advice only within the context of our written advisory agreement with each AlphaCore client. It should not be assumed that any strategy or investment recommendations or decisions we make in the future will be profitable.
Any specific security or strategy is subject to a unique due diligence process, and not all diligence is executed in the same manner. All investments are subject to a degree of risk, and alternative investments and strategies are subject to a set of unique risks. No level of due diligence mitigates all risk, and does not eliminate market risk, failure, default, or fraud. There is no guarantee that any investment strategy will achieve its objectives, generate profits or avoid losses. Past performance is not indicative of future results.
Before embarking on any investment program, you should carefully consider the risks and suitability of a strategy based on your own investment objectives and financial position. Equity investments entail equity risk and price volatility risk. The potential for profit is accompanied by the possibility of loss. Market disruption can be caused by economic, financial or political events and factors. Such disruptions could lead to increased market volatility, reduced liquidity in the securities markets, or significant negative impacts on issuers and the securities markets. Investments in private funds can involve higher risks the lack of liquidity and as the funds are not publicly traded, and, as a result, the fair value of these investments may not be readily determinable