2025 Q1 2025 Commentary: Diversification Works
In one sense, this is one of the easiest commentaries that we’ve ever put together, because we know what’s on the top of everyone’s minds:
- Tariffs,
- Volatility around tariff announcements, and
- Market reactions to both of the above.
However, this is also one of the trickiest commentaries we’ve ever had to write. Even though we know exactly what we want to talk about, the truth is that we don’t know what’s going to happen. What’s comforting for us, but may be disquieting for you, is that nobody else knows what’s going to happen either. (Really: Nobody knows.)
So how do you invest around that type of uncertainty? Well, it’s very unlikely that someone could have predicted the magnitude and the scope of the tariffs that were announced on April 2, or the subsequent rollbacks and their timing. We certainly couldn’t have predicted which investments would succeed in this environment, though we wish we could.
A common saying in the investing world is that diversification means you’re always apologizing for something. Not every investment strategy is going to work 100% of the time; if there was such a thing, we wouldn’t have to write commentaries every quarter to explain our performance. Still, we remain committed to the principle of diversification, and it’s exactly because of market environments like these. By giving you exposure to a variety of strategies, we can help fortify your portfolios to the widest variety of outcomes, and help you meet your goals.
Since we haven’t found that silver bullet strategy quite yet, though, let’s walk through performance so far this year.
YTD Recap
It’s been a whirlwind of a start to 2025. As of April 12, U.S.-based markets have walked back a lot of their 2024 gains – with plenty of whipsaws in between. The S&P 500 dipped into correction before intensifying into a full-blown meltdown after the April 2 tariff announcements, with the S&P 500 ultimately sliding -18.8% through April 8. The rebound on April 9 was also one for the books: the 10th best day for the S&P 500 since 1928.
Meanwhile, many traditional ballasts did not hold up as well as expected. Long-term U.S. Treasuries suffered, with the yield on the 10-Year U.S. Treasury Note rising to 4.5% by April 11.[1] [2]The dollar also weakened, an unusual occurrence as tariffs typically lead to stronger domestic currencies. During this topsy-turvy period, many of our favorite multi-strategy managers were caught flat-footed, and performance so far year to date has been lackluster.
This reality underscores the fact that every investment strategy is going to have periods when it struggles.
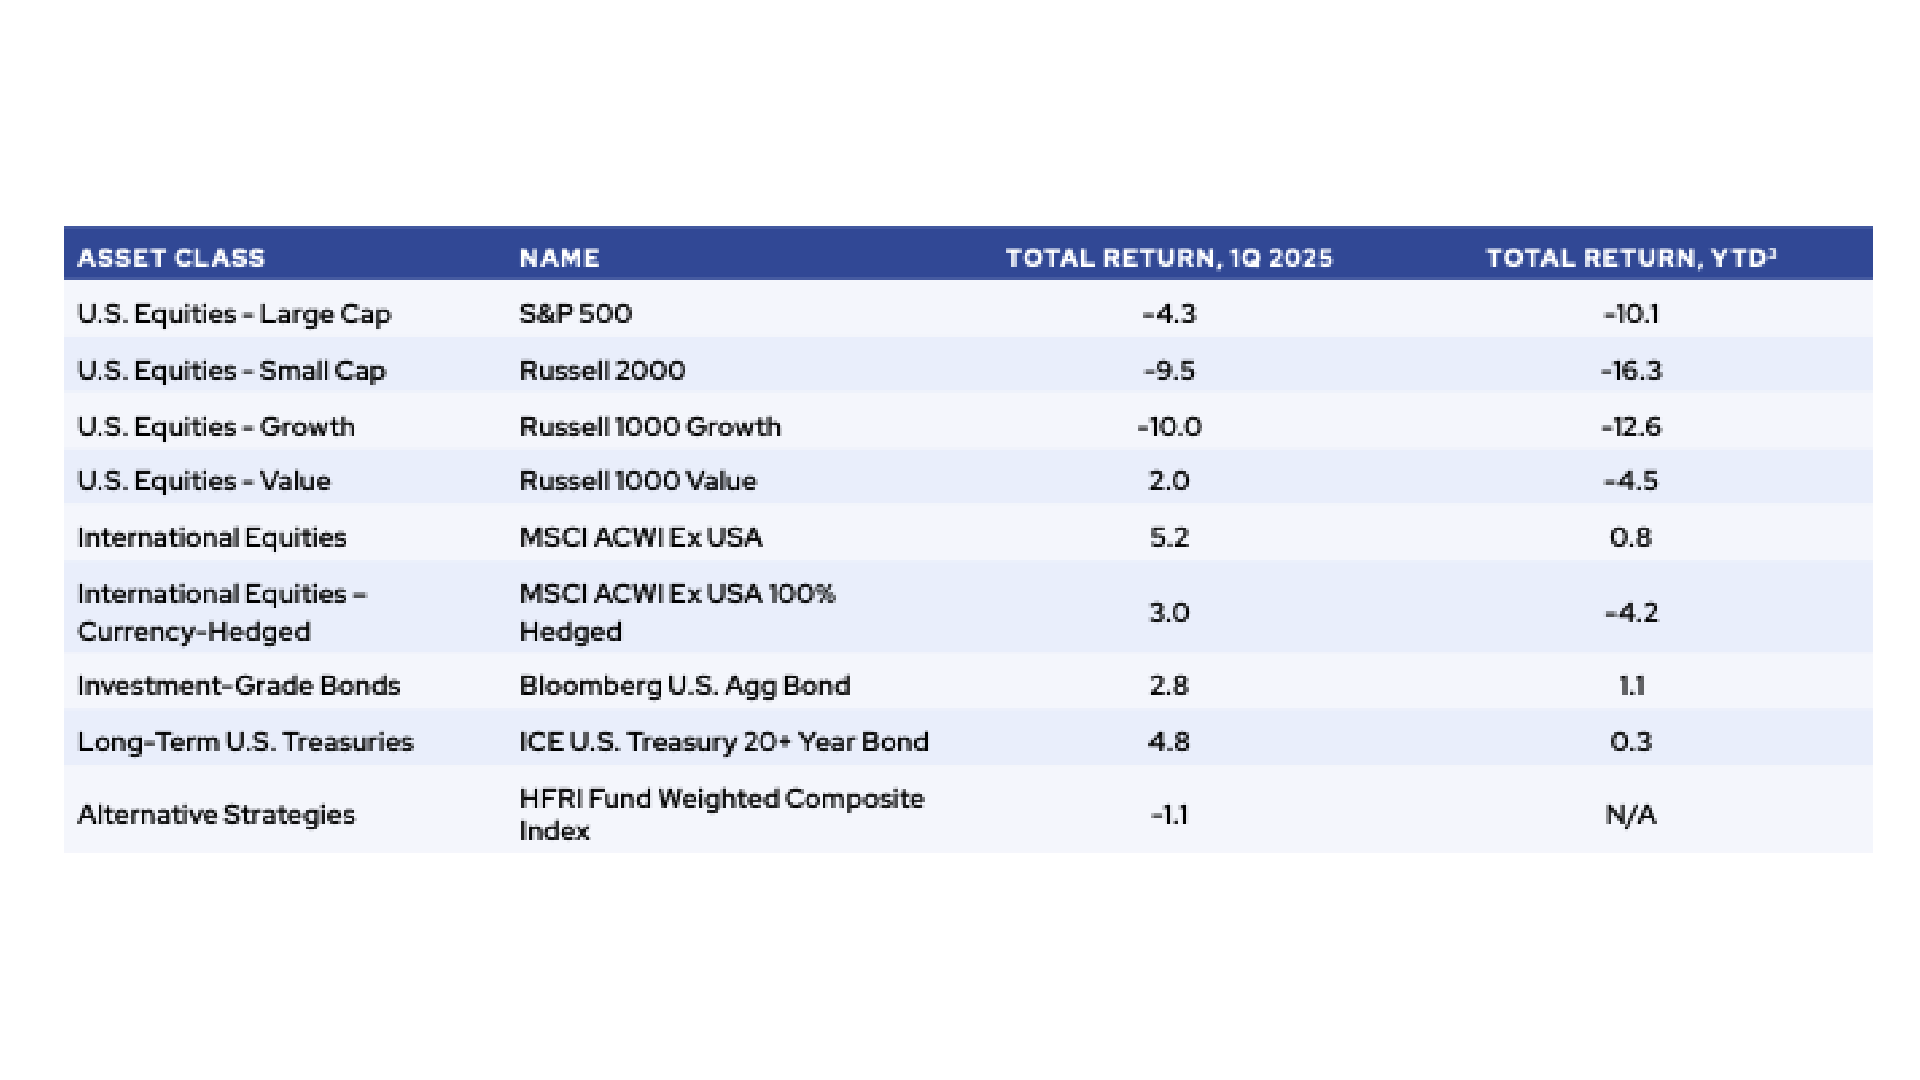
Source: Morningstar, HFRL, Data as of April 13, 2025.
“Total Return, YTD”[3]
So what did work? Instead of the dollar or U.S. Treasuries, investors’ concern about tariffs flowed through into other safe haven assets. Purchases of gold pushed the spot price to 3,254 on April 11, an all-time high.[4] Previously unloved international stocks also experienced a return to form. The first quarter was the single strongest period of outperformance for the ACWI ex-US against the S&P since 1989, a trend that has carried through into April.[5] Could we have anticipated that international stocks and gold would have been two of the most resilient asset classes in this environment? Probably not, but sometimes it’s better to be lucky than good.
SO WHAT ARE THE MARKETS SO CONCERNED ABOUT?
Relative to history, the announced tariffs represent a seismic reset in trade policy. For at least the next 90 days, policymakers have set the new effective tariff rate on China at 105% (including exemptions of semiconductors and other technologies, which are still evolving), Canada and Mexico have rates of 17% and 15% respectively, while most other countries are now at 10%.[6] These tariffs constitute the most substantial change to U.S. trade policy enacted in the last century, with new import-weighted effective tariff rate estimated to be initially close to 26% before supply chains adjust to the levies.
FIFURE 2. U.S. AVERAGE EFFECTIVE TARIFF RATE SINCE 1790
Customs duty revenue as a percent of goods imports
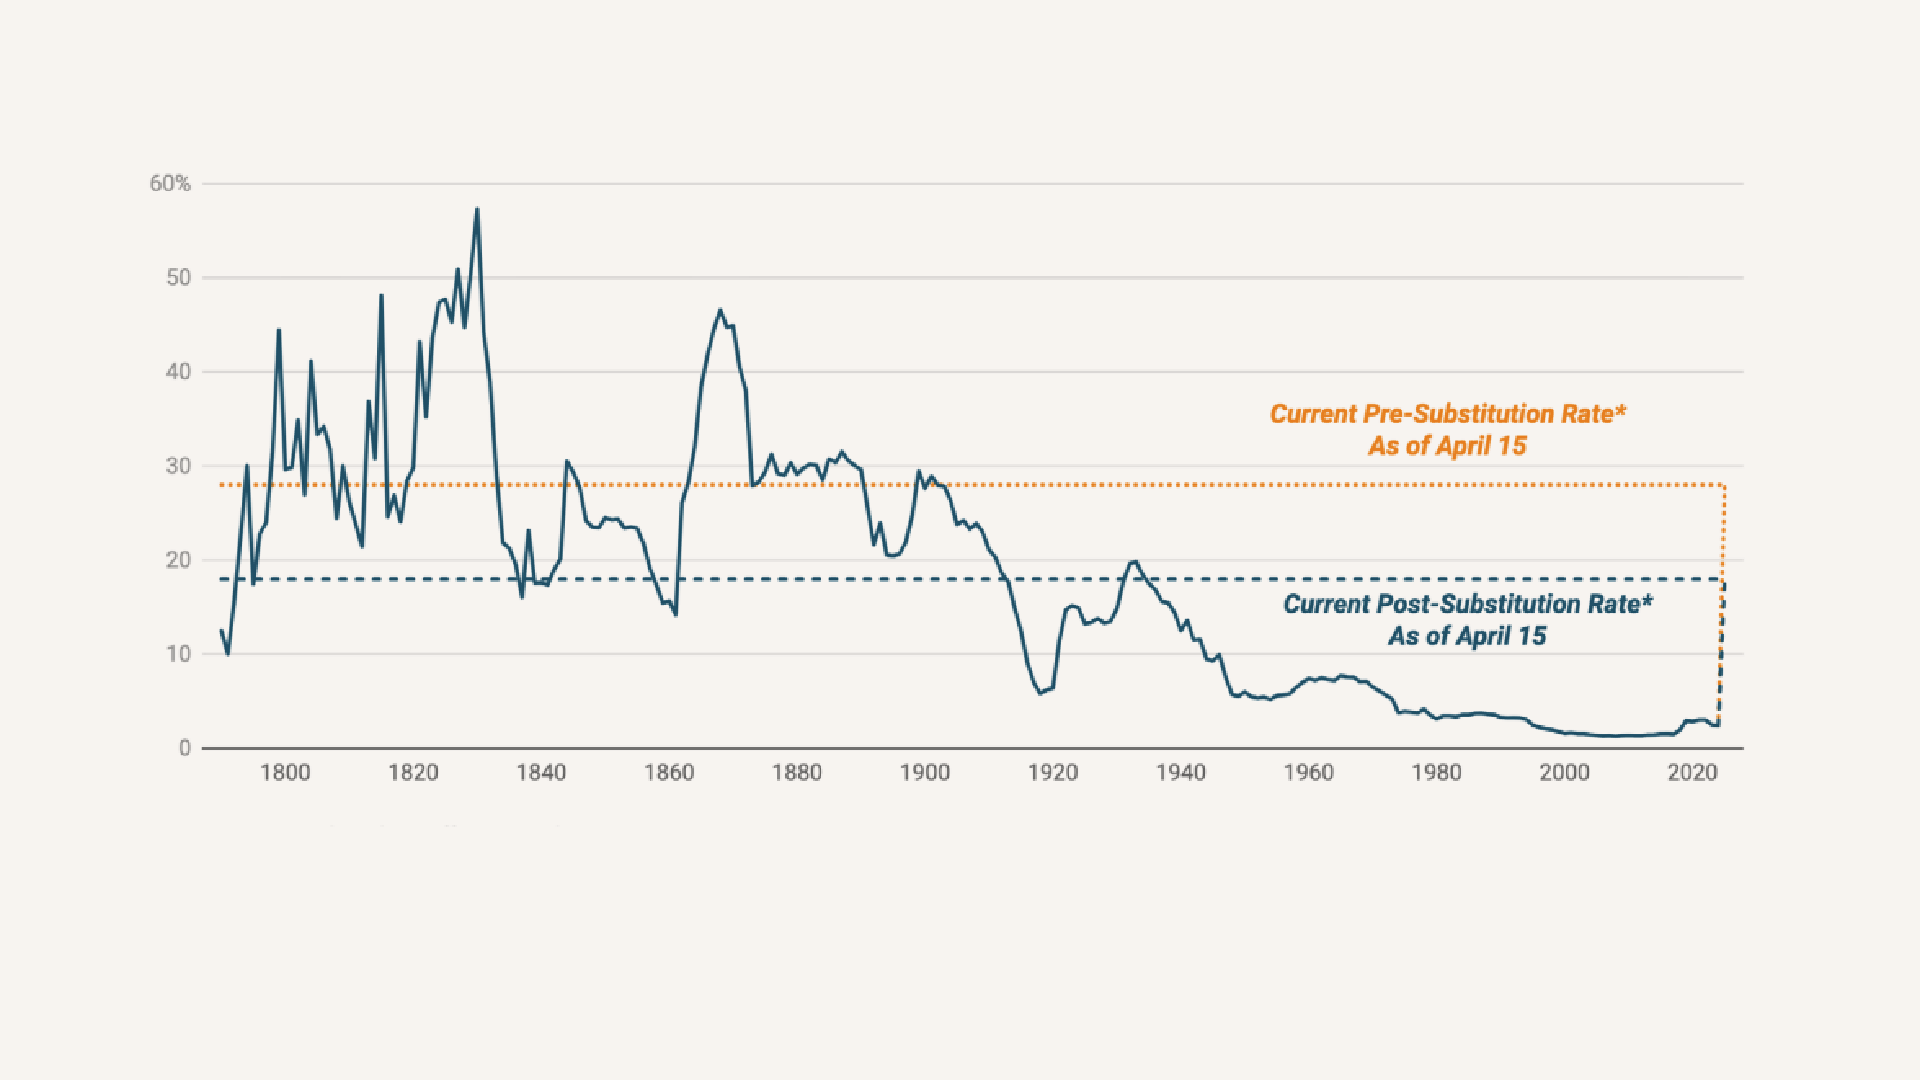
* Assumes revised April 9 tariffs stay in place. | chart: The Budget Lab | Source: Historical Statistics of the United States Ea424-434, Monthly Treasury Statement, Bureau of Economic Analysis, The Budget Lab analysis.* | created with Datawrapper | Source: Yale Budget Lab. Data as of April 15, 2025
These tariffs are expected to be highly disruptive, partially because the U.S. is much more exposed to the impact of tariffs now than it was the last time tariffs were this high. Back in the 1920s, imports made up 3% of GDP. Now, they make up 15% of GDP – in other words, we may be up to five times more exposed as an economy to the price of our imports now than we were then.[7]
The scope of the tariffs matters because tariffs are a tax on the American consumer, plain and simple. Taxes of this magnitude would have a few immediate effects. They may reduce the economy’s productivity, by an estimated 25 to 35% for every ten percentage point increase in tariffs.[8] (A reduction in productivity will ultimately slow an economy’s growth, unless something else like AI innovation offsets it.) Although the impacts are nuanced, tariffs may also temporarily increase inflation. Markets fear any increase in inflation, even when it’s likely to be temporary, because it will make it harder for the Fed to bring inflation down to its 2% target.
No matter what tariffs ultimately get implemented, the uncertainty has created distortions in the business environment that make it very difficult to identify trends. Companies have frozen hiring, proactively raised prices, and pulled forward earnings guidance. Consumers have rushed to purchase foreign goods such as car seats and iPhones.
HOW DOES THIS MANIFEST IN THE DATA?
The latest projection from the Atlanta Fed’s GDPNow model is for a 0.3% annualized contraction in real GDP in the first quarter, before any of the reciprocal tariffs were even announced.[9]
To be fair, this forecast is very likely too bearish. A big part of the downdraft comes from consumers trying to front-run tariffs by buying a highly anomalous amount of imports. Still, even correcting for this, growth looks poised to be weaker in the first quarter. Unfortunately, we just don’t know by how much.
However, we can be fairly certain of one thing: tariffs are going to result in worse living standards for the average American in the short term. It’s estimated that households will experience a decline in real disposable income of $4,900 on average from the levies implemented to date.[10]
FIGURE 3. EVOLUTION OF ATLANTA FED GDP NOW REAL GDP ESTIMATE FOR 2025: Q1
Quarterly percent change (SAAR)
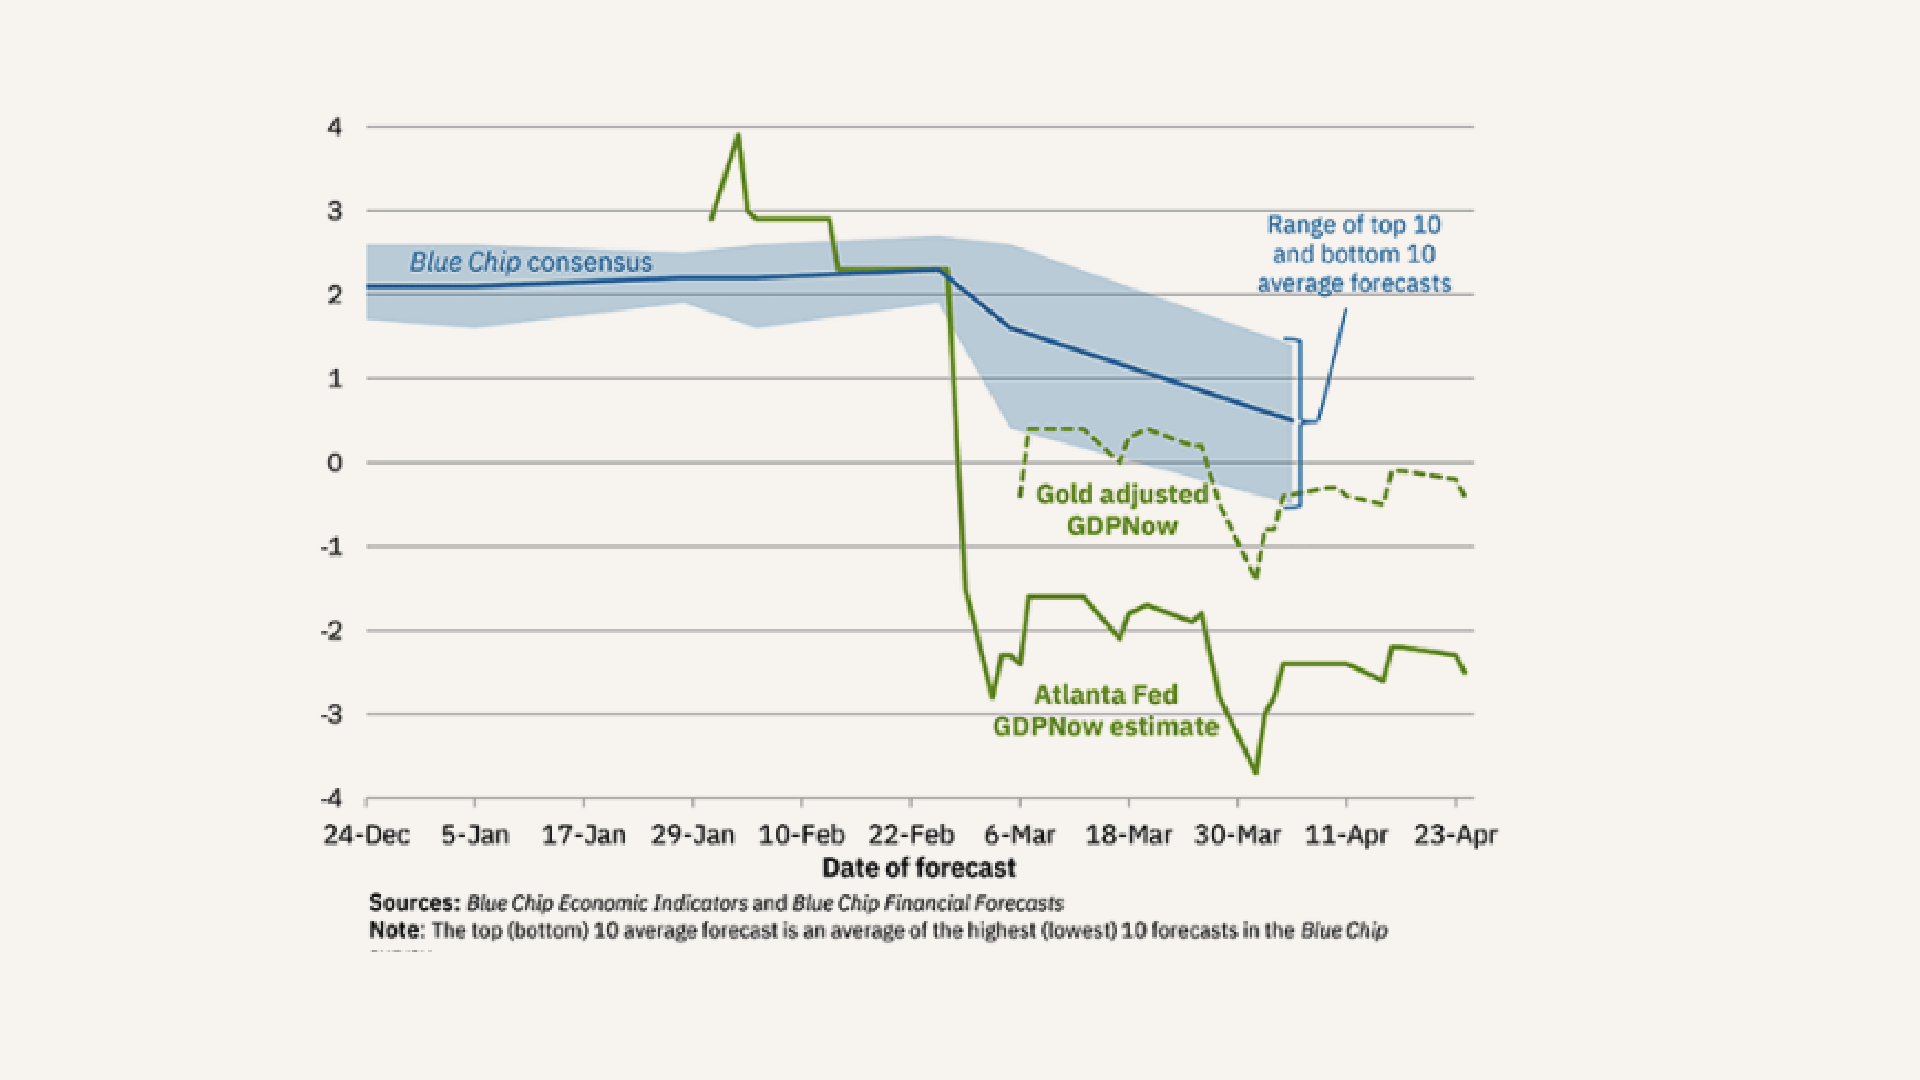
Source: Atlanta Fed. Data as of as of April 12, 2025.
SELF-FULFILLING PROPHECY?
The twin risks of slower growth and higher inflation make this investing environment tricky. Recent Fed guidance indicates that even they’re having a hard time figuring out what the best path forward is. Although the economy started from a very healthy place, one reason to tread cautiously in this environment is that recessions can be self-fulfilling: consumers and businesses fret about the future, and curtail spending in the present.
So what are we watching? Unsurprisingly, we’re watching consumer spending – it’s nearly 70% of the U.S.’s GDP, after all.[11]We’re watching inflation data, which if it continues to tick upward will make it even harder for the Fed to support the market in a slower growth environment. We’re also watching the impact of this latest fiscal budgetary cycle and the DOGE’s review, to see the net effect of government spending and any knock-on effects on growth. Finally, we’re watching the continued advancements of AI in China and elsewhere – the DeepSeek news has long since faded from the headlines, but AI firms both at home and abroad continue to innovate, underscoring just how unpredictable these secular technological advancements can be.
When trying to digest all of this uncertainty, we are seeking refuge in simple, stable investments that mitigate the impact of the unknowns.
We still like the U.S. economy in the long run and believe it has demonstrated a remarkable level of resilience. With valuations still fairly stretched, we expect equity markets to remain volatile as macro data and policy moves continue to court uncertainty. We believe in the power of stocks to compound returns over long time horizons, but we remain selective with our equity exposure today, and continue to favor companies that generate strong free cash flow with lower degrees of cyclicality.
In contrast to the uncertainty we still face in equity markets, we have a high degree of visibility into what bonds are likely to generate, because starting yields are highly predictive of future returns. All-in-yields remain highly compelling, with ETFs that track the Bloomberg Aggregate Bond Index currently yielding close to 4.9%, and many sectors yielding much more than that.[12] In particular we continue to favor securitized credit over corporate credit given the relative yield advantage. We also like specialized exposures within alternative credit, particularly floating-rate forms of debt that are better equipped to withstand inflation surprises and interest rate volatility.
Real estate has been a challenged place to invest over the past three years as the asset class has digested the rate hiking cycle and its after-shocks. On a go-forward basis some parts of real estate are starting to look more attractive, however the future direction of interest rates is still a big question mark. We are exploring the possibility of onboarding an infrastructure solution as a complement to our real estate holdings in a lower-growth, higher-inflation scenario.
Finally, while multi-strategy portfolios have faced headwinds, their underlying risk frameworks are designed for moments like this—periods where restraint and discipline matter more than chasing momentum. We expect these managers to right the ship in due course.
Conclusion
Here at AlphaCore, your advisors are constantly scouring the latest data to keep you abreast of all of the rapidly changing developments, sifting through the noise as we try to find actionable signals. We showed the chart below in our last letter a few weeks back, and we’ll show it again because it’s an important one. This chart demonstrates the importance of abiding by a simple principle: time in the market is much, much more important than timing the market.
FIFURE 4. IMPACT OF TIME OUT OF THE MARKET, 1988-FEB 2025
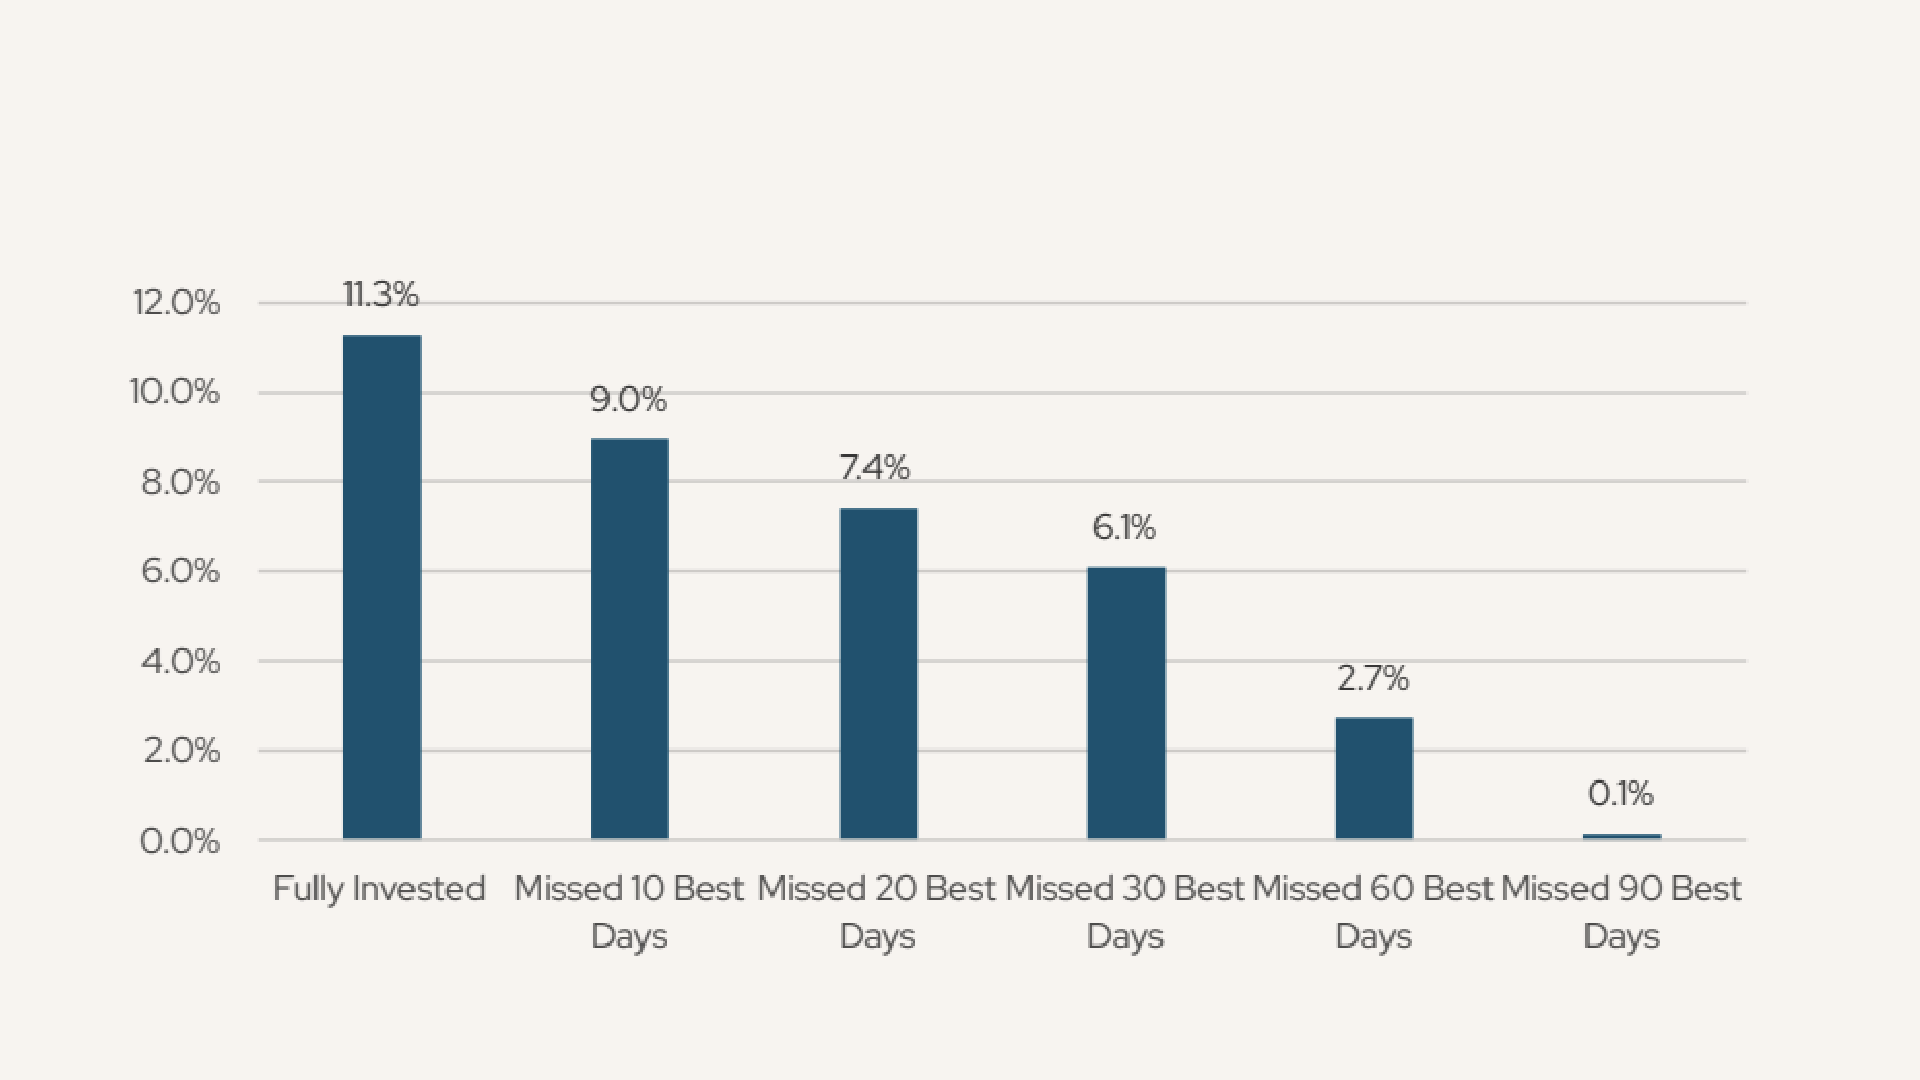
Source: Morningstar. Data as of March 10, 2025.
Take the example of the last few weeks. The initial sell-off on April 3 and 4 was the fourth-worst in the post-war period for the S&P 500. It would be understandable to want to sell after a market move that severe. If you had, you would have missed the 10th best single day in S&P 500 history going all the way back to 1928 – just three trading days later.
However, we don’t rely on consistency alone to drive returns. As you may recall, AlphaCore’s guiding principle is Win More By Losing Less. To us, that means building portfolios that diversify across both traditional and alternative investments. Diversification means that in any given market environment, at least one piece of your portfolio will likely be struggling—but it’s also what allows us to construct resilient, all-weather portfolios built for the long haul. That resilience helps us to stay focused on your goals, even during volatile markets.
Please reach out if you have any questions!
APPENDIX
The president’s views on tariffs long predate this current administration. Take a gander at this newspaper clipping from 1989:
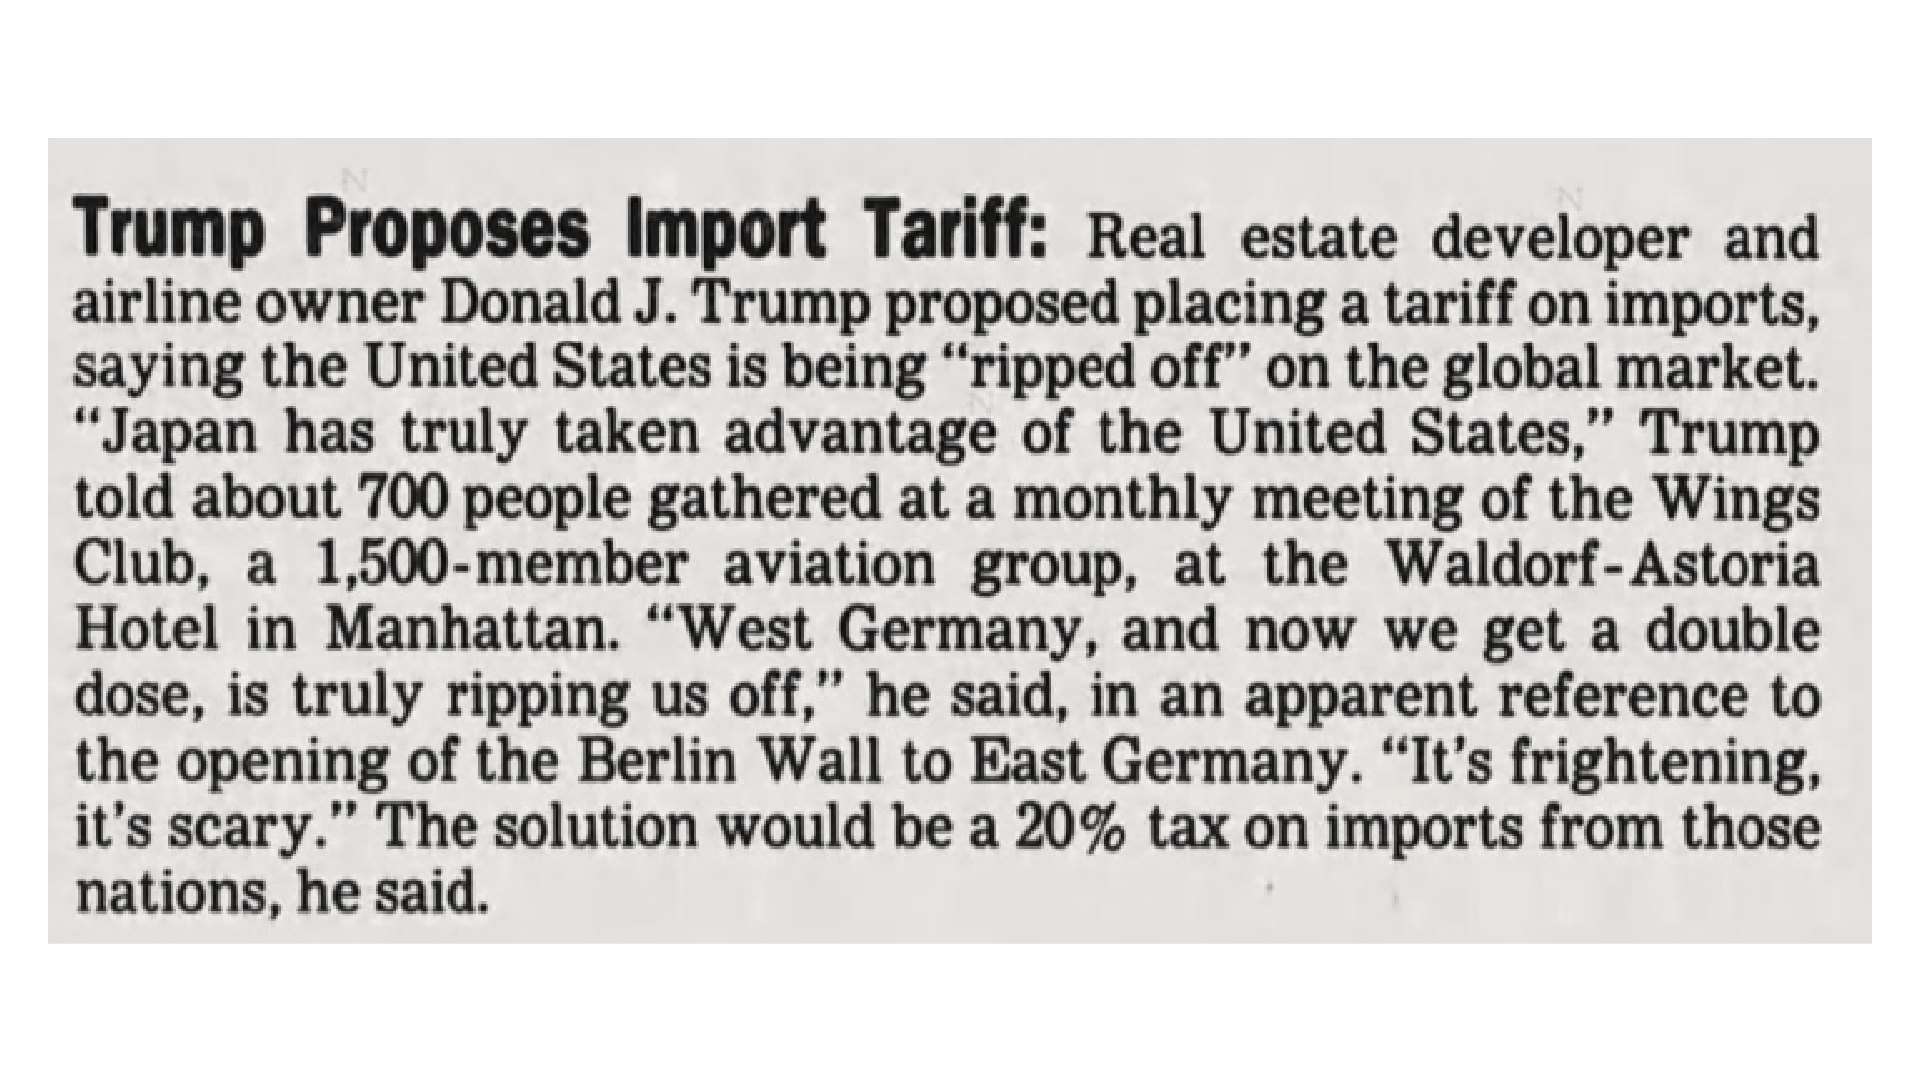 Source: “Trump Proposes Import Tariff.” Los Angeles Times, November 14, 1989. Story accessed on April 21, 2025.
Consumer pushback to tariffs stretches back even farther. This Puck cartoon is from 1909, the last time U.S. tariffs were this high:

Source: Puck Magazine, May 12, 1909. Accessed via the Library of Congress on April 21, 2025.
This chart underscores just how unusual it is for the dollar and U.S. Treasury yields to move in opposite directions. Recall that yields and bond prices are inverted, which means that rising yields correspond to falling prices.
US YIELDS AND DOLLAR HAVE PARTED COMPANY
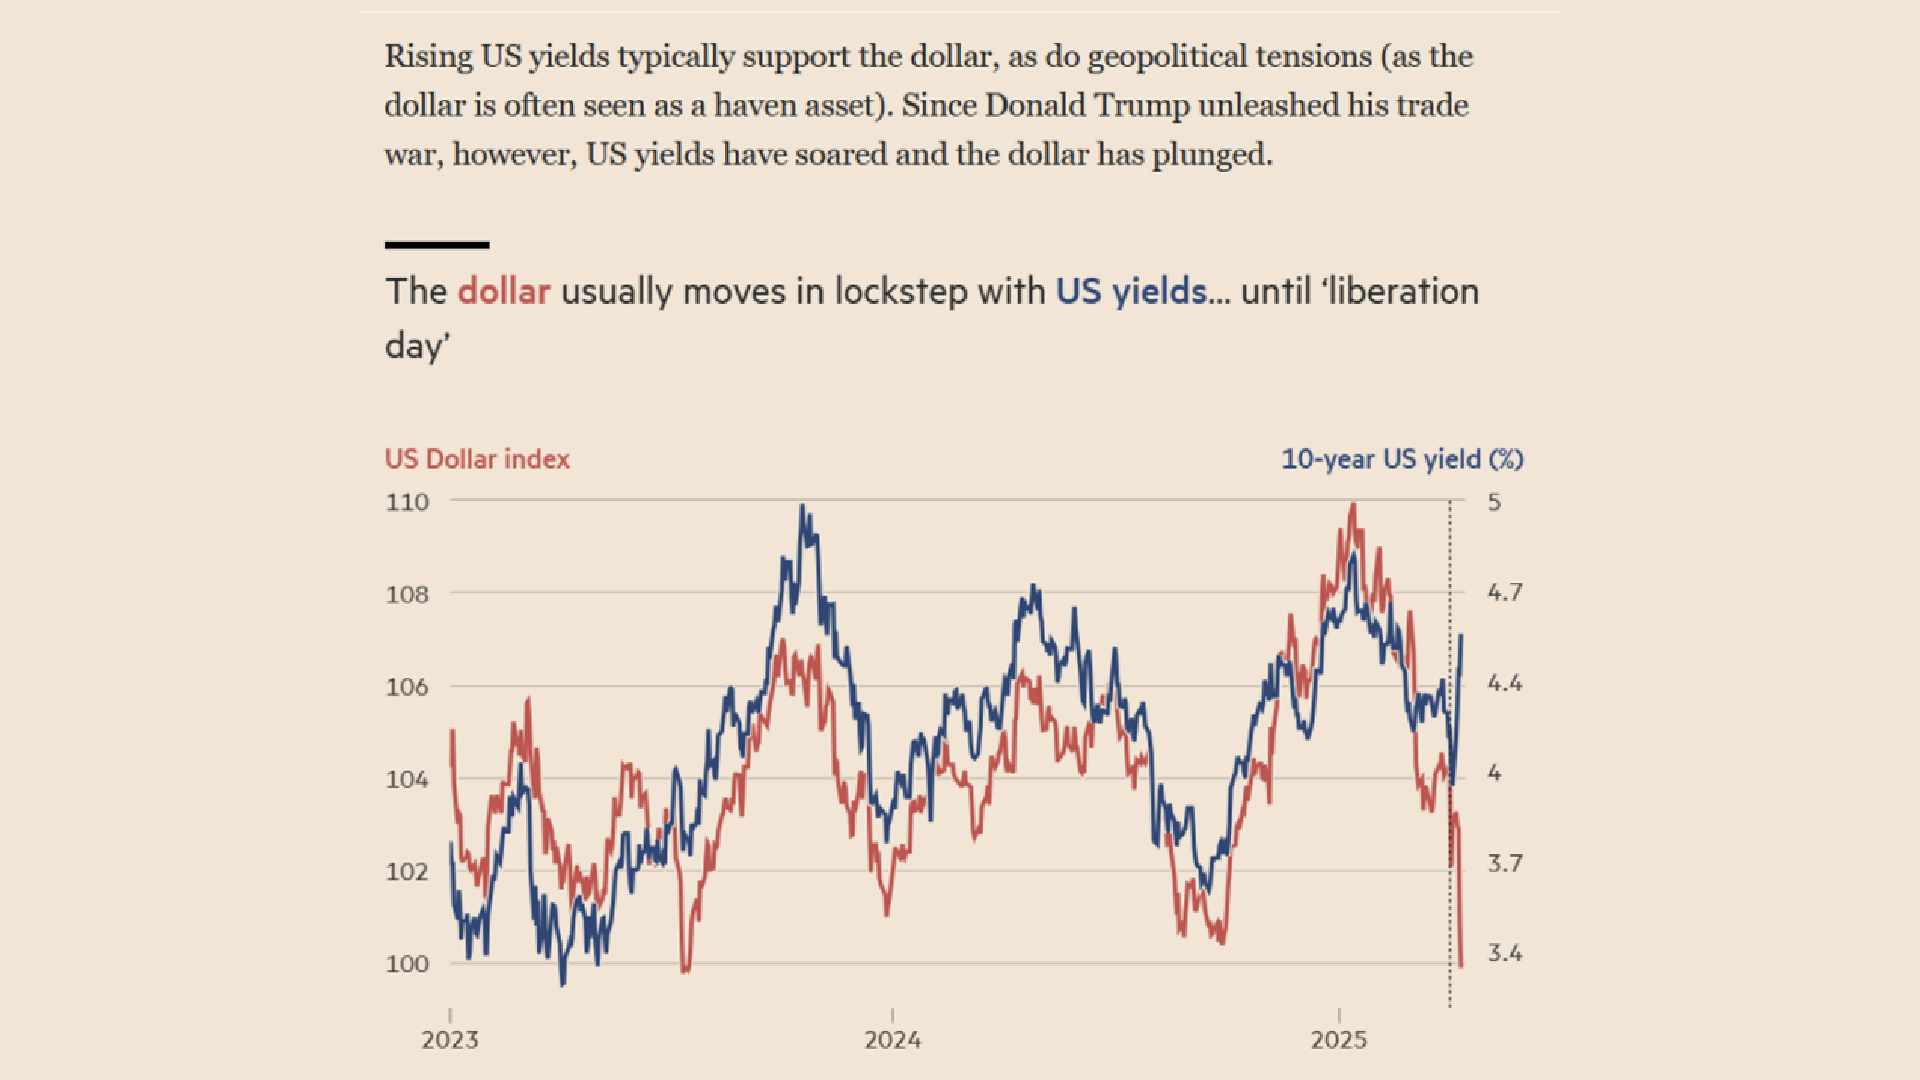
Source: Financial Times. Data as of April 11, 2025.
The dollar dropping in value is also uncommon during equity market selloffs. There have been 16 selloffs of this magnitude or larger over 5 days over the last 45 years. In 13 of those 16 selloffs, the dollar appreciated in value, as measured by the Dollar Index (“DXY”).
DX Y PERCENTAGE CHANGE DURING 5-DAY S&P 500 SELLOFFS OF 13% OF MORE
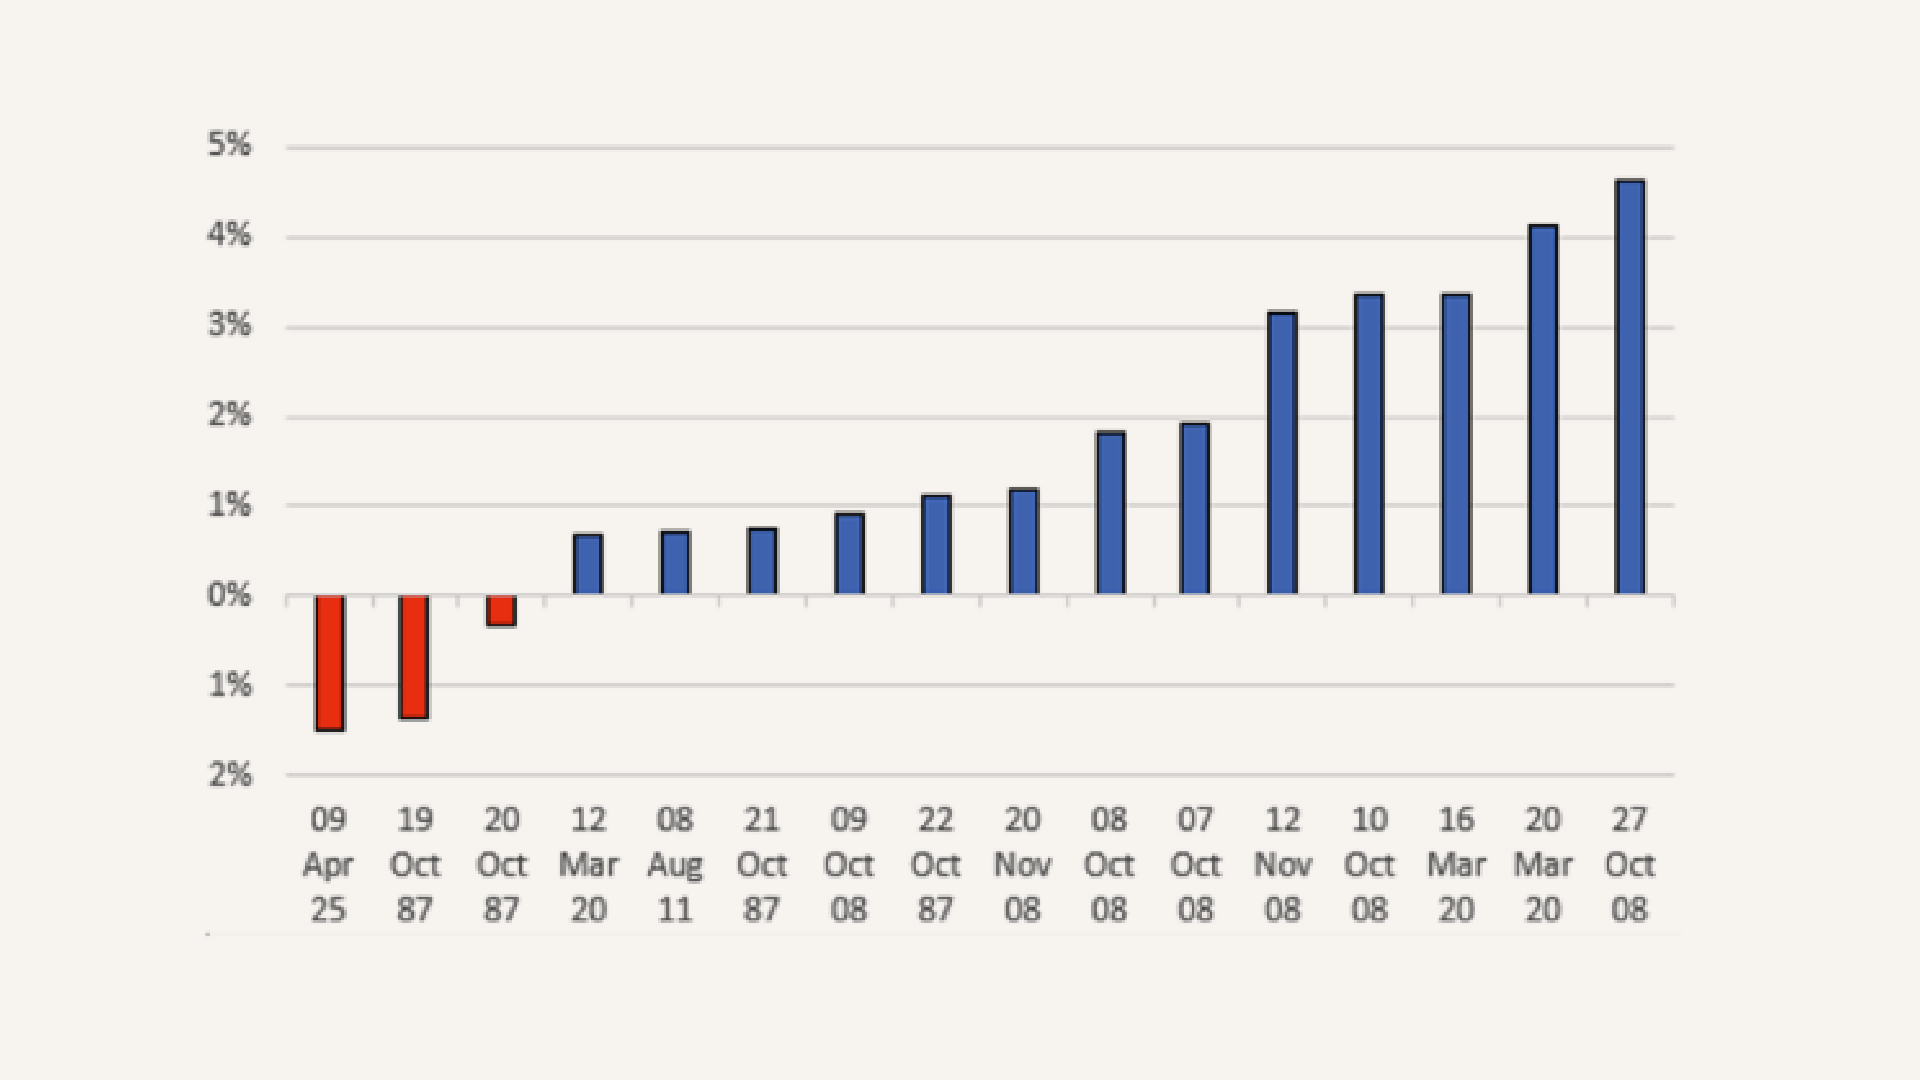
Source: Mike Bird, Wall Street Editor of the Economist. Chart sourced via X. Data as of April 9, 2025.
So why is gold bucking the trend? A better question to ask might be: Who is buying all that gold? While we’ve seen retail interest start to perk up, the real answer is that it’s primarily central banks:
CENTRAL BANKS’ GOLD RUSH
Annual change in gold demand, 2019-2024
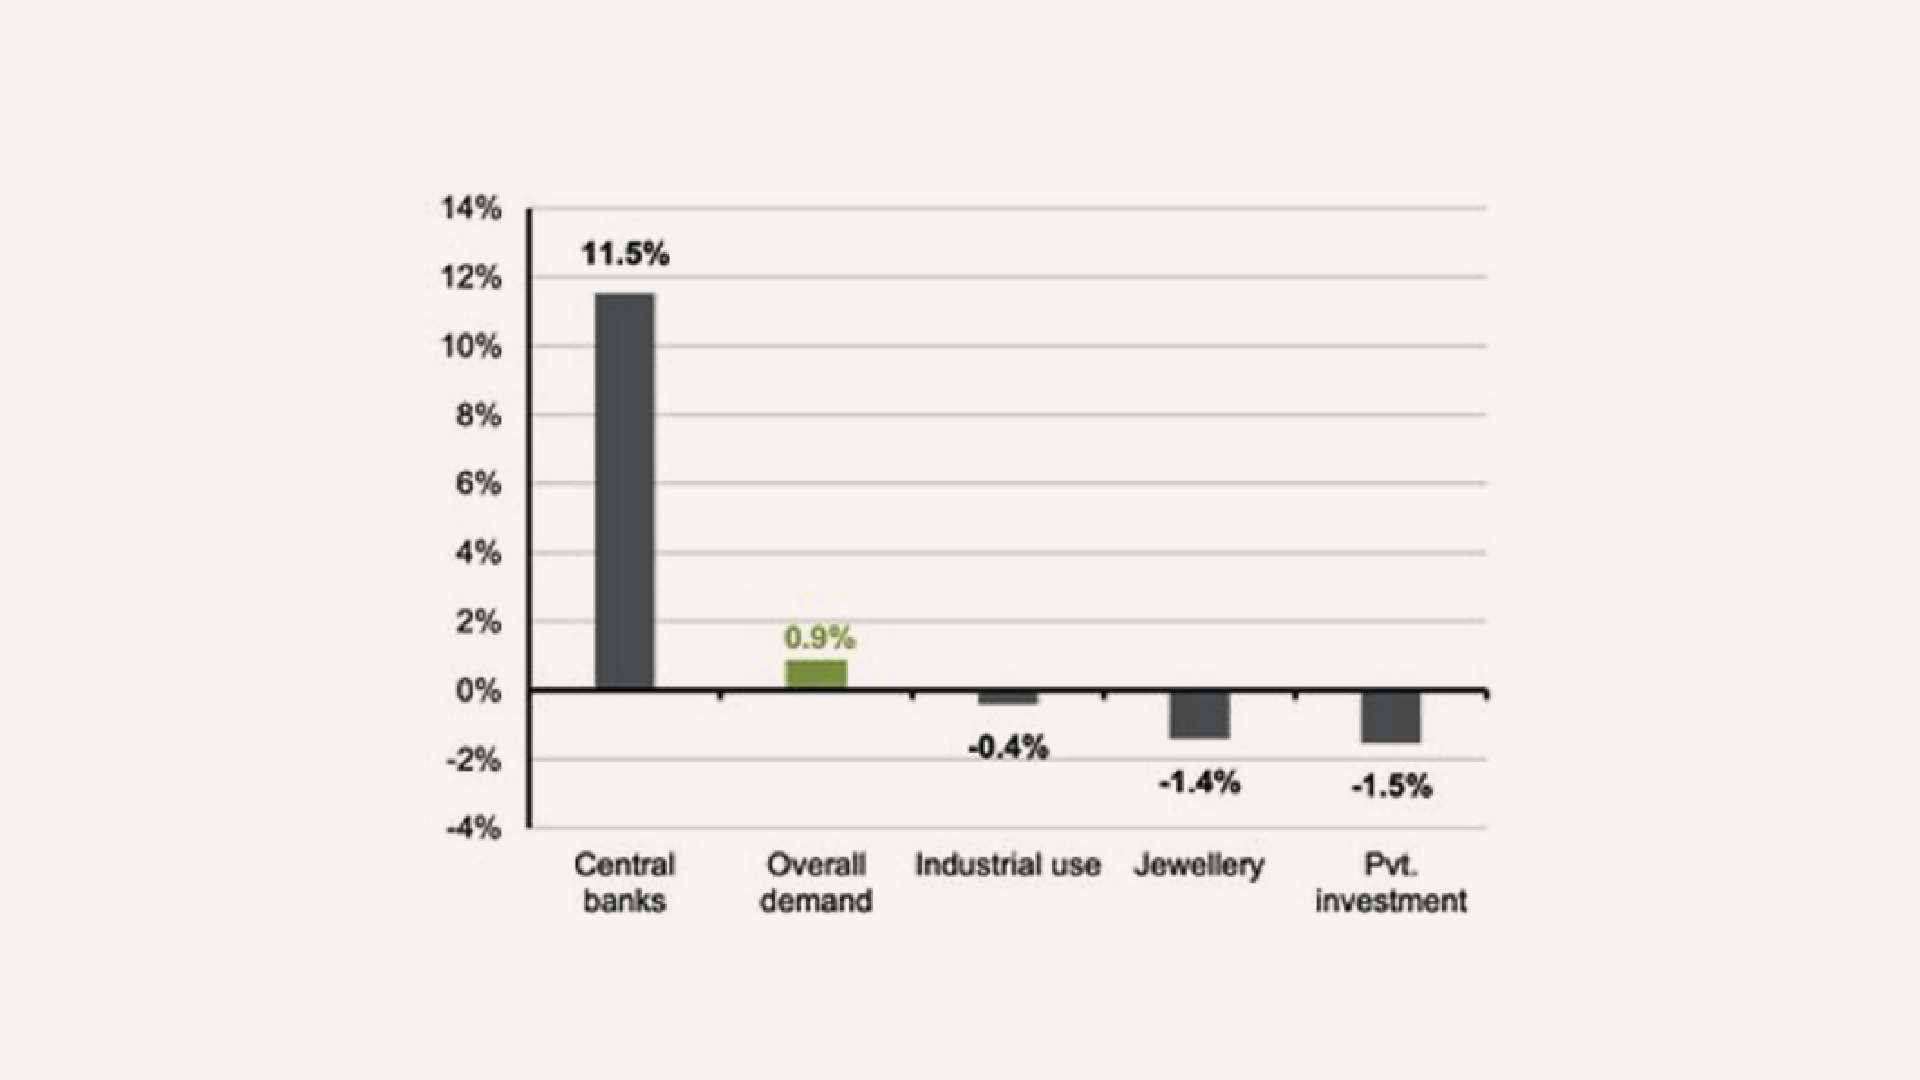
Source: JPMorgan Asset Management. Data as of March 3, 2025.
Amid all of this focus on tariffs on goods to restore the trade balance, it can be easy to forget that the U.S. is no slouch when it comes to exports. They just come in the form of services instead of goods.
THERE’S MORE TO U.S – E.U. TRADE THAN GOODS
The dominant U.S. position in services gives it something to lose
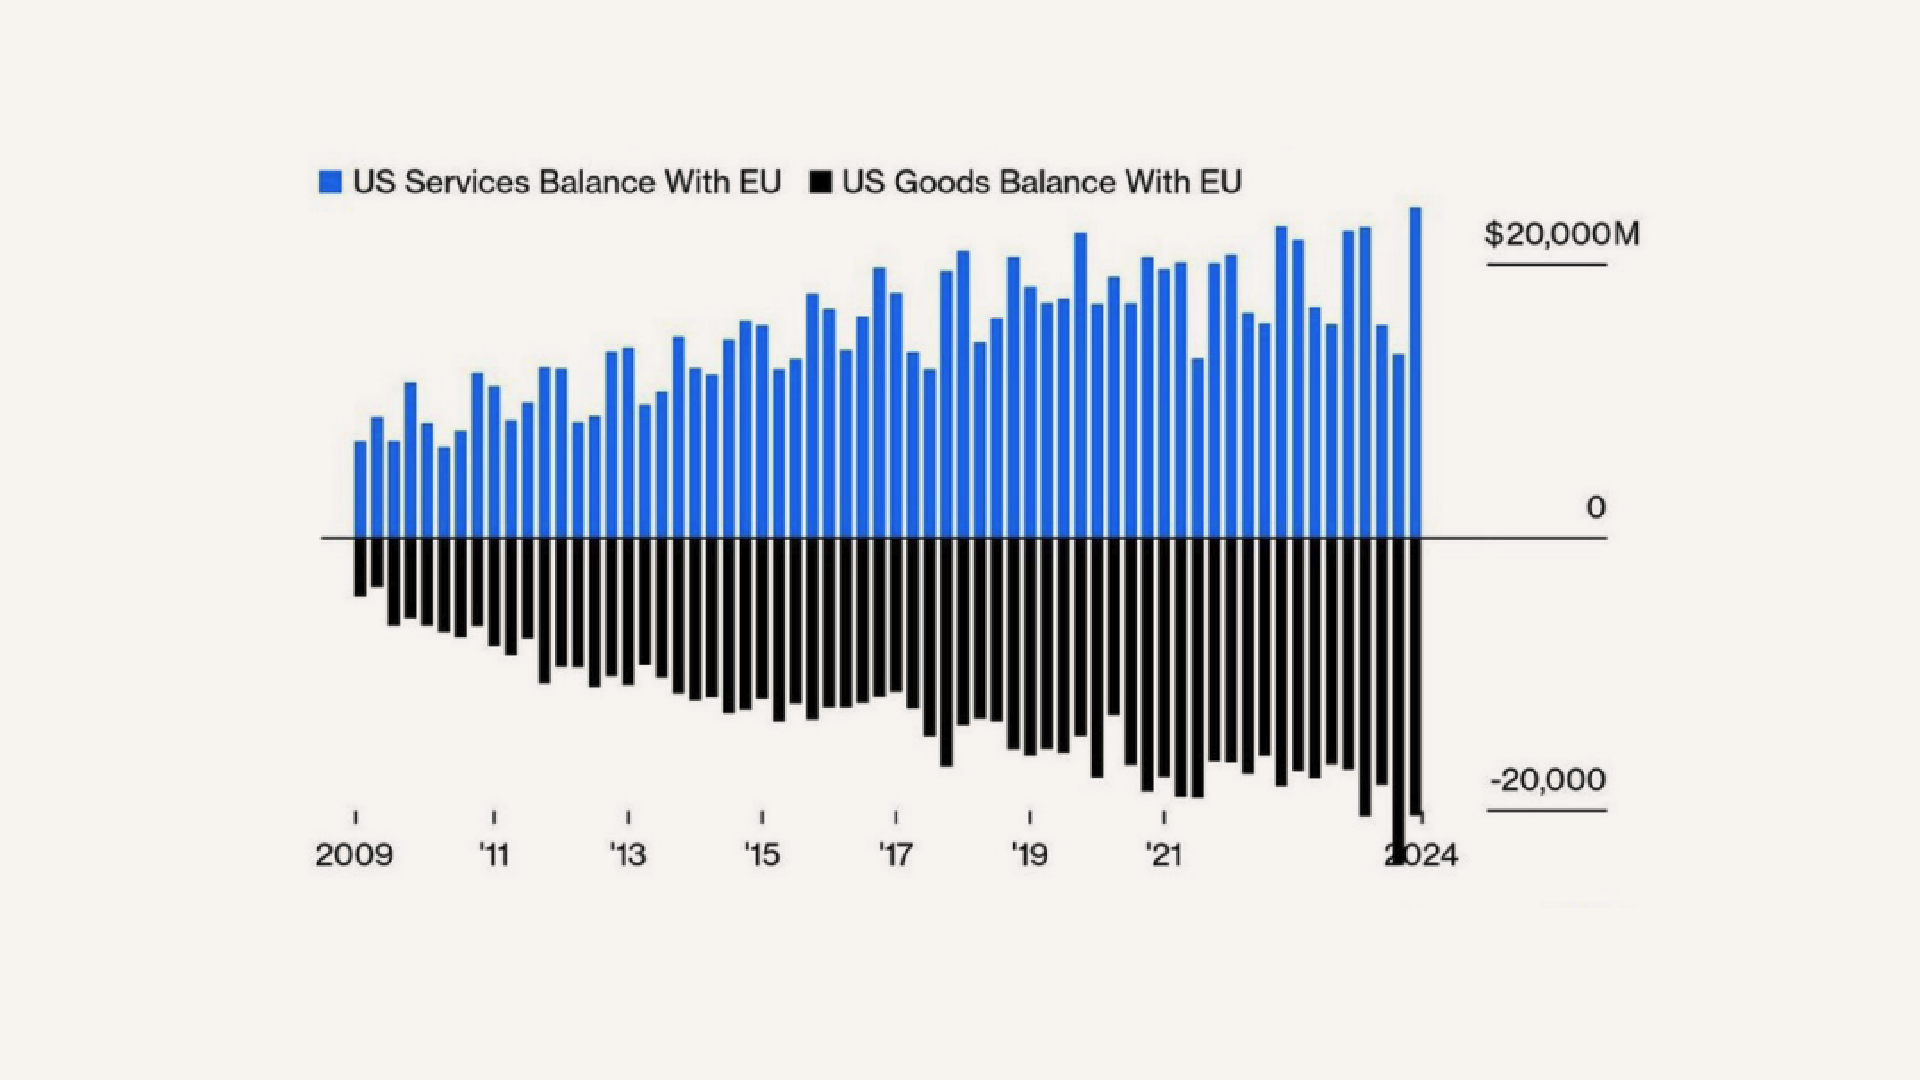
Source: Bloomberg. Data as of April 7, 2025
One thing we try to keep in mind when speaking to clients is that peoples’ perceptions of the economy are very much informed by their political affiliations. That even applies to expectations of future price increases:
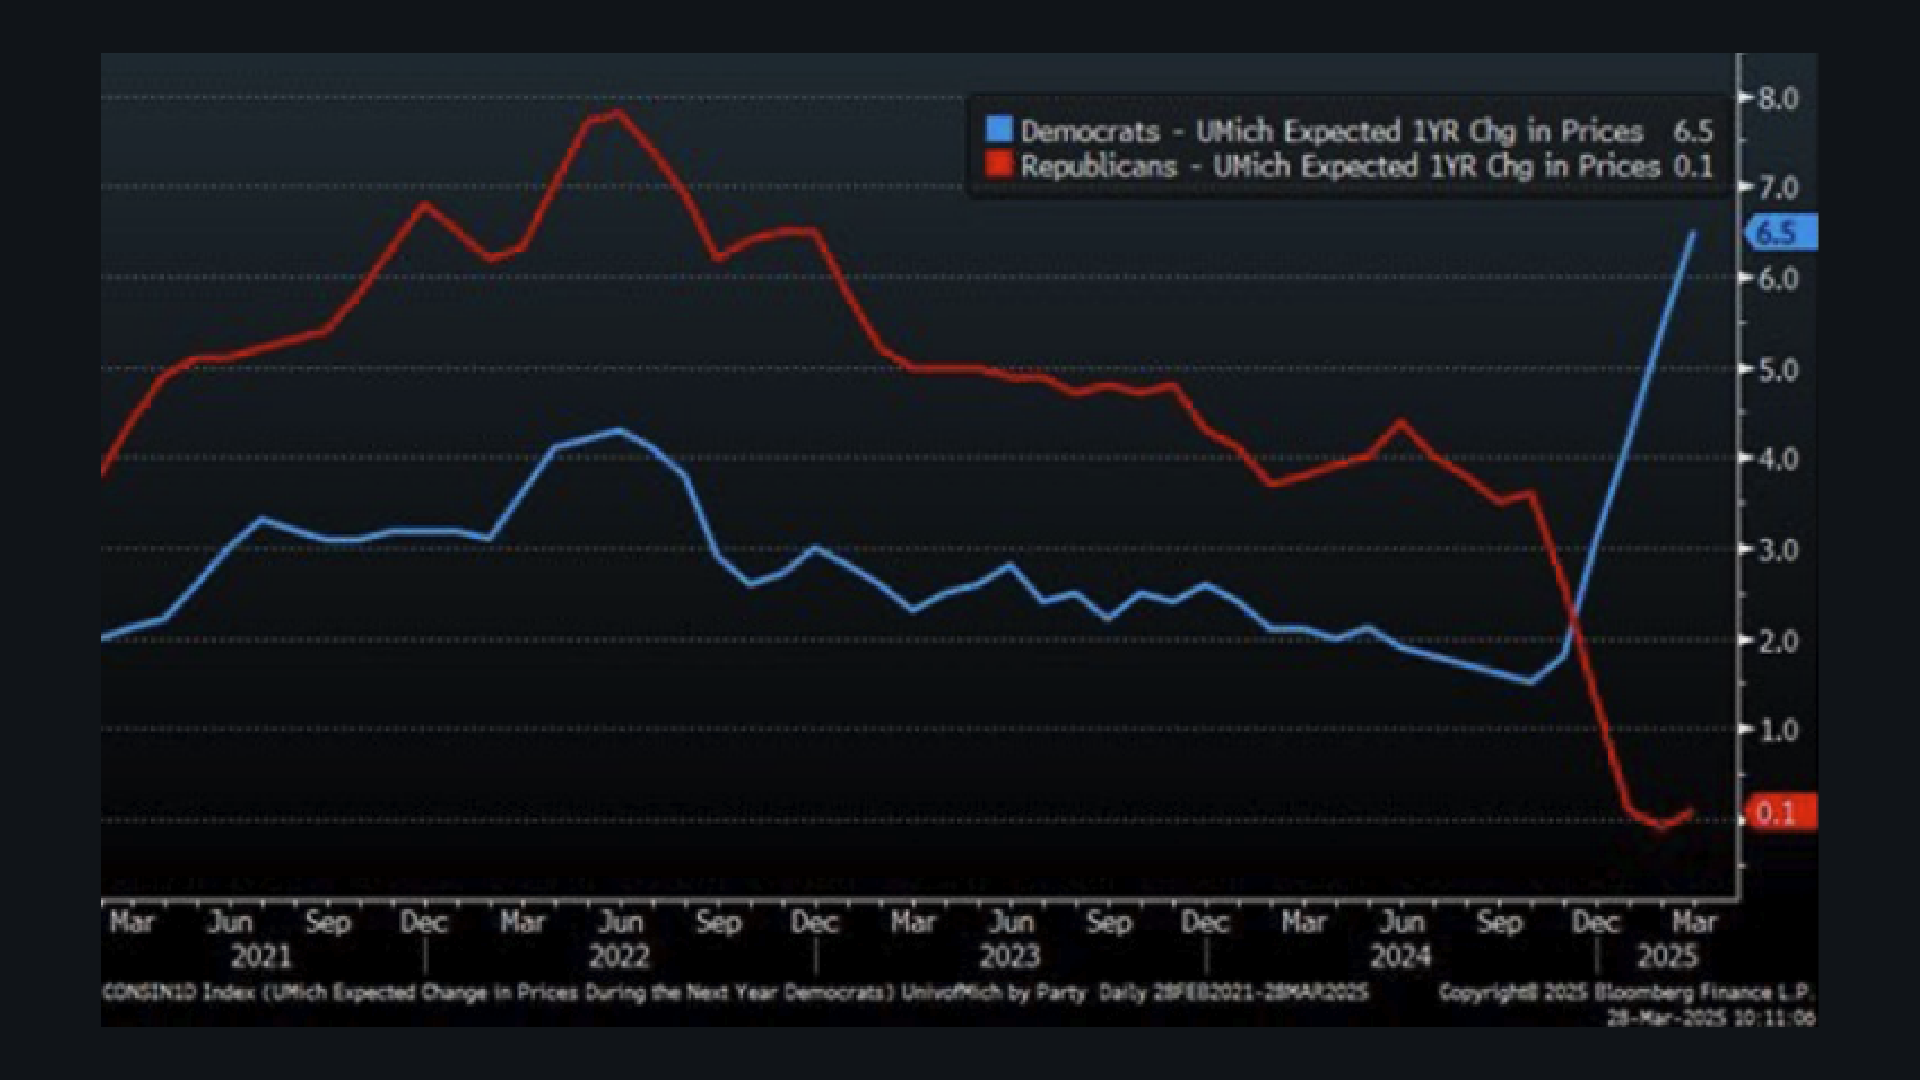
Source: University of Michigan Consumer Sentiment Survey. Data as of March 28, 2025.
We also try to keep in mind that although the American consumer is in remarkable shape, that generalization overlooks the fact that many lower-income households are struggling mightily against the impacts of inflation.
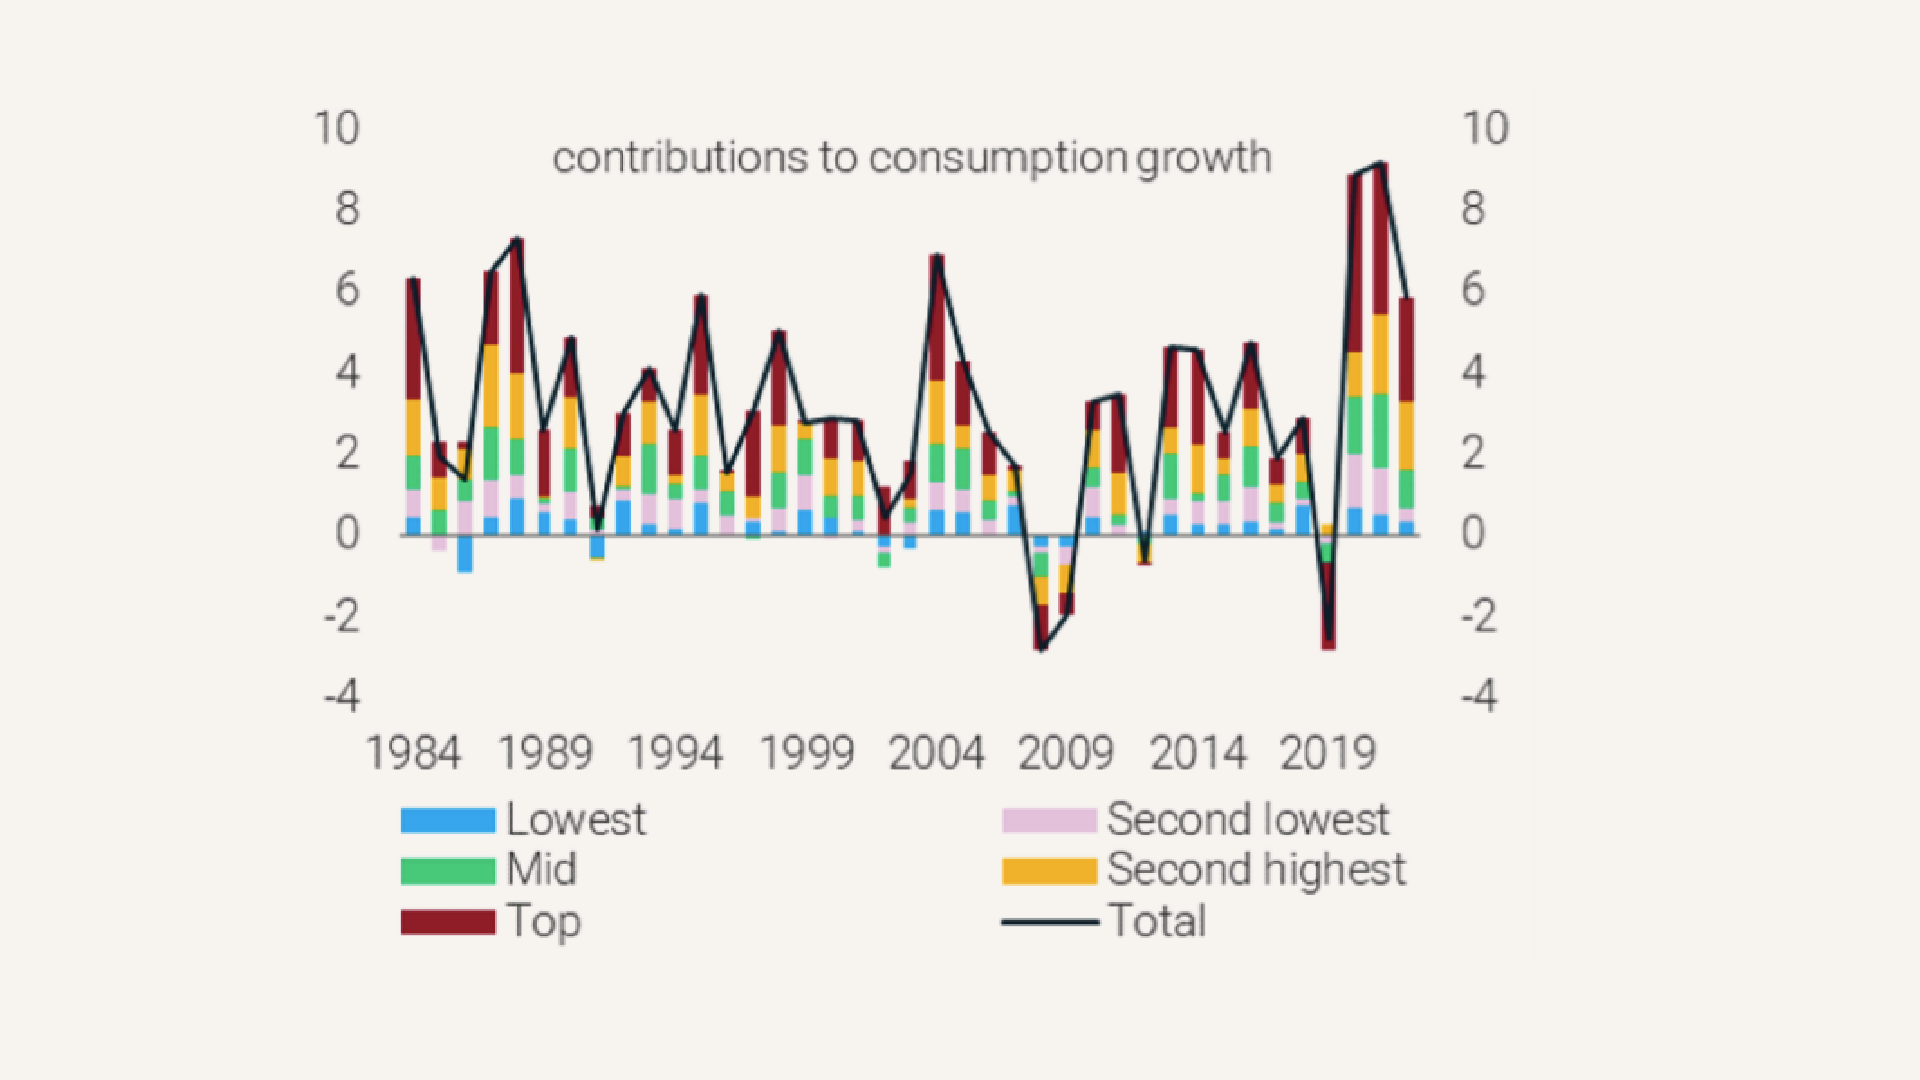
Source: U.S. Bureau of Economic Analysis via FRED®. Data as of March 31, 2025.
And to wrap the commentary, a reminder that we as humans tend to have short memories. Recessions are quite normal, historically speaking:
TIME SPENT IN RECESSION BY DECADE
% of Time Spent in Recession by Decade. Since 1900s
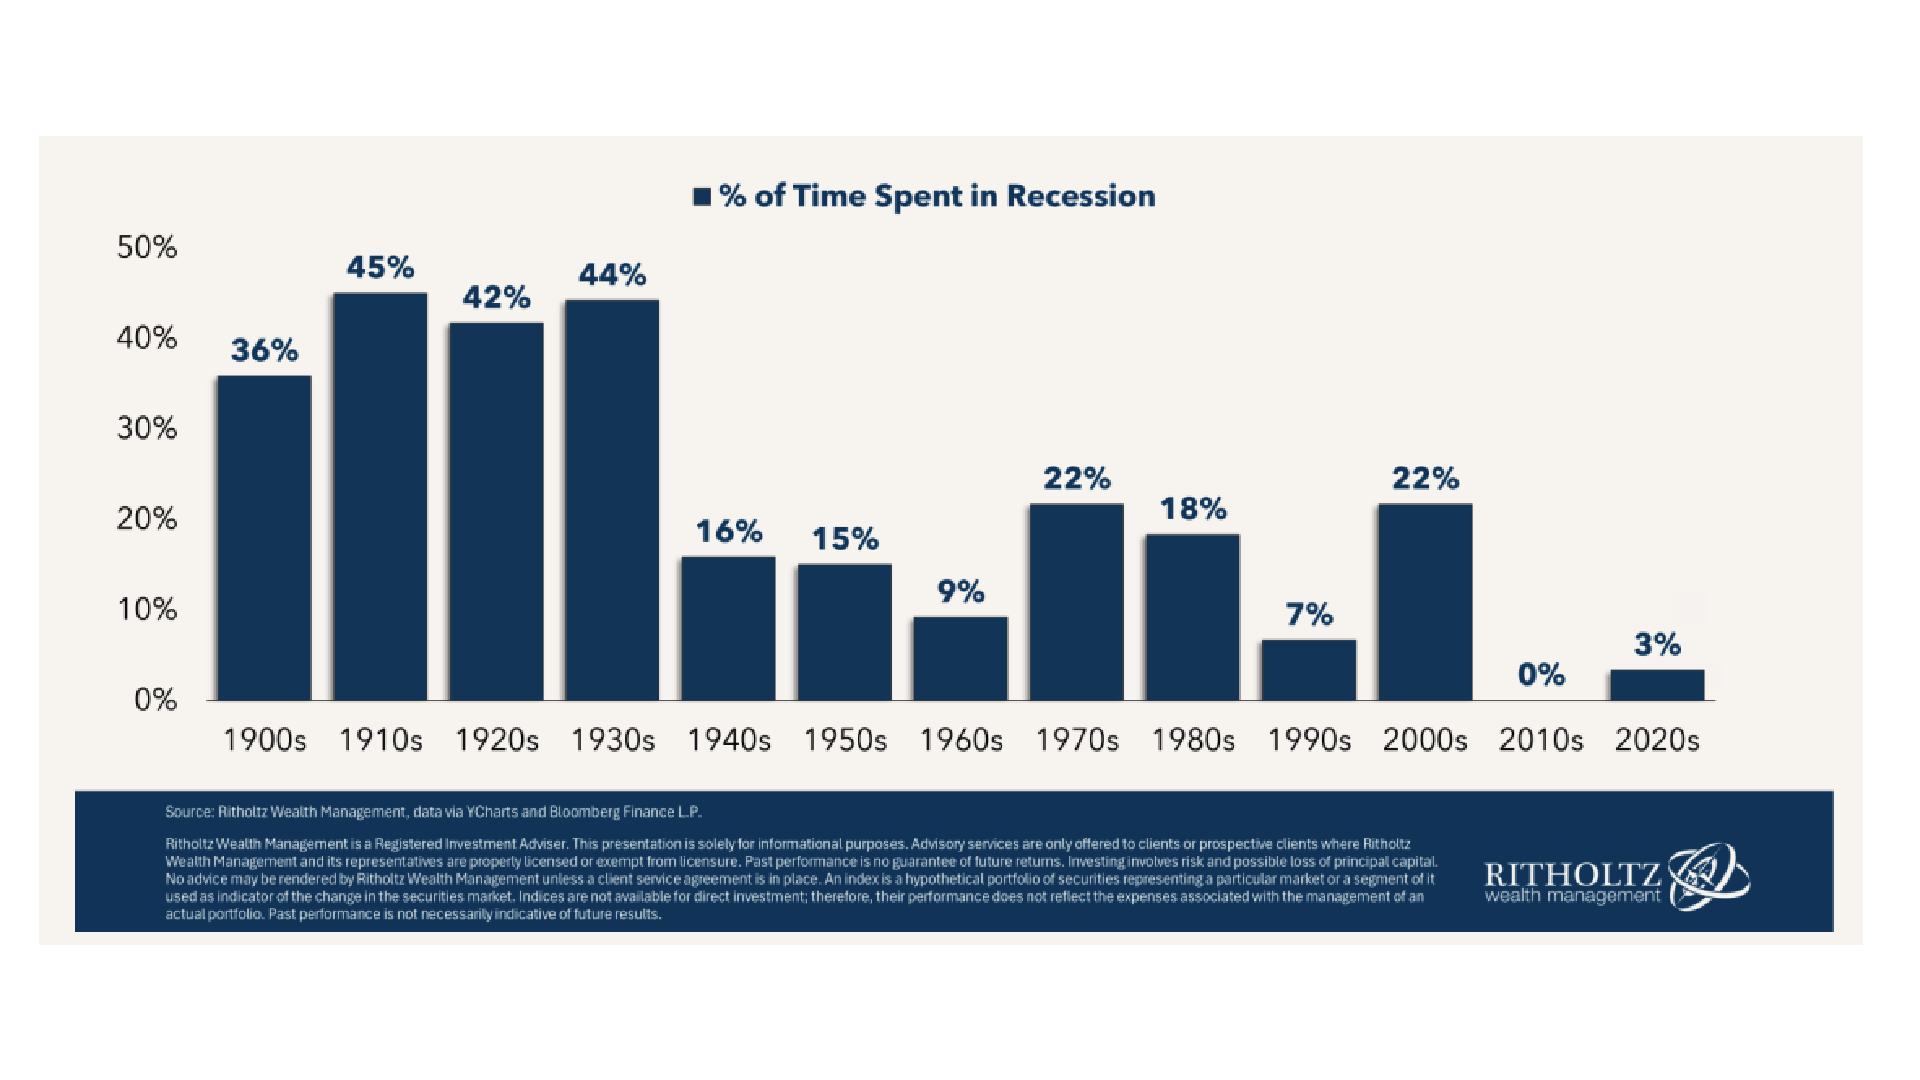 Source: A Wealth of Common Sense. Data as of January 21, 2025.
Market Indices
S&P 500 INDEX: S&P 500 index is a float-adjusted market-cap weighted index, largely reflecting the large-cap U.S. equities. The index includes 500 leading companies and captures approximately 80% coverage of available market capitalization.
RUSSELL 2000 INDEX: A comprehensive view of small-cap performance, the Russell 2000 measures the performance of approximately 2,000 small-cap US equities.
RUSSELL 1000 GROWTH INDEX: The Russell 1000® Growth Index measures the performance of the large cap growth segment of the US equity universe. It includes those Russell 1000 companies with relatively higher price-to-book ratios, higher I/B/E/S forecast medium term (2 year) growth and higher sales per share historical growth (5 years). The Russell 1000® Growth Index is constructed to provide a comprehensive and unbiased barometer for the large-cap growth segment. The index is completely reconstituted annually to ensure new and growing equities are included and that the represented companies continue to reflect growth characteristics.
RUSSELL 1000 VALUE INDEX: The Russell 1000® Value Index measures the performance of the large cap value segment of the US equity universe. It includes those Russell 1000 companies with relatively lower price-to-book ratios, lower I/B/E/S forecast medium term (2 year) growth and lower sales per share historical growth (5 years). The Russell 1000® Value Index is constructed to provide a comprehensive and unbiased barometer for the large-cap value segment. The index is completely reconstituted annually to ensure new and growing equities are included and that the represented companies continue to reflect value characteristics.
MSCI AWCI EX USA INDEX: The MSCI ACWI ex USA Index captures large and mid-cap representation across 22 of 23 Developed Markets (DM) countries (excluding the US) and 24 Emerging Markets (EM) countries*. With 2,156 constituents, the index covers approximately 85% of the global equity opportunity set outside the US.
MSCI ACWI EX USA US DOLLAR HEDGED: The MSCI ACWI ex USA US Dollar Hedged Index represents a close estimation of the performance that can be achieved by hedging the currency exposures of its parent index, the MSCI ACWI ex USA Index, to the USD, the “home” currency for the hedged index. The index is 100% hedged to the USD by selling each foreign currency forward at the one-month Forward rate. The parent index is composed of large and mid-cap stocks across 22 Developed Markets (DM) countries and 24 Emerging Markets (EM) countries.
BLOOMBERG U.S. AGGREGATE BOND INDEX: The index consists of approximately 17,000 bonds. The index represents a wide range of securities, from investment grade and public to fixed income.
ICE U.S. TREASURY 20+ YEAR BOND INDEX: ICE U.S. Treasury 20+ Year Bond Index tracks the performance of US dollar denominated sovereign debt publicly issued by the US government in its domestic market. Qualifying securities must have greater than or equal to twenty years remaining term to final maturity as of the rebalancing date, a fixed coupon schedule and an adjusted amount outstanding of at least $300 million. The amount outstanding for all qualifying securities is adjusted to reduce by the amounts held by the Federal Reserve’s SOMA account. Bills, inflation-linked debt, original issue zero coupon securities and STRIPs are excluded from the Index; however, the amounts outstanding of qualifying coupon securities are not reduced by any portions that have been stripped. Agency debt with or without a US Government guarantee and securities issued or marketed primarily to retail investors do not qualify for inclusion in the index.
PERSONAL CONSUMPTION EXPENDITURES (PCE) INDEX: A measure of prices that people living in the United States, or those buying on their behalf, pay for goods and services.
U.S. DOLLAR INDEX (“DXY”): The U.S. Dollar Index (USDX, DXY, DX, or, informally, the “Dixie”) is an index (or measure) of the value of the United States dollar relative to a basket of foreign currencies, often referred to as a basket of U.S. trade partners’ currencies. The Index goes up when the U.S. dollar gains “strength” (value) when compared to other currencies.
HFRI FUND WEIGHTED COMPOSITE INDEX: The HFRI Fund Weighted Composite Index is a global, equal-weighted index of single-manager funds that report to HFR Database. Constituent funds report monthly net of all fees performance in U.S. Dollar and have a minimum of $50 Million under management or a twelve (12) month track record of active performance. The HFRI Fund Weighted Composite Index does not include Funds of Hedge Funds.
COMMENTARY CONTRIBUTORS
Eric Gerster, CFA®
Chief Investment Strategist
Johann Lee, CFA®
Director of Research
Edward J. Durica, III, CFA®
Senior Wealth Advisor
Madeline Hume, CFA®
Senior Research Analyst
IMPORTANT INFORMATION
AlphaCore is a registered investment adviser. Registration does not imply a certain level of skill or training. Information presented is for educational purposes only and does not intend to make an offer or solicitation for the sale or purchase of any specific securities, investments, or investment strategies. Investments involve risk and, unless otherwise stated, are not guaranteed. Be sure to first consult with a qualified financial adviser and/or tax professional before implementing any strategy discussed herein. Past performance is not indicative of future performance.
The opinions expressed herein are as of the date of publication and are subject to change due to changes in the market or economic conditions, and may not necessarily come to pass.
Sources:
__________________________________________________________
[1] Source: Board of Governors of the Federal Reserve System (U.S.) via FRED®. Data as of April 21, 2025.
[2] When yields rise, bond prices fall.
[3] YTD Period is through April 11, 2025.
[4] Source: CME Group. Data as of April 12, 2025.
[5] Source: JPMorgan Guide to the Markets. Data as of April 1, 2025.
[6] Many of the goods exported from Mexico and Canada still qualify for the MCA exemption, which reduces the effective tariff rate below the stated 25% in practice.
[7] Source: Bloomberg. Data as of April 2, 2025.
[8] Klein, Alexander, and Christopher M. Meissner. “Did Tariffs Make American Manufacturing Great? New Evidence from the Gilded Age.” National Bureau of Economic Research, Nov. 2024. Accessed April 3, 2025.
[9] Gold purchases have been so substantial in recent weeks – nearly tripling from $13.2 billion in December to $32.6 billion in January, according to AtlantaFed – that they’ve ended up skewing the GDP forecasts to the downside, so the model produces a second forecast that adjusts for that impact. This adjustment helps bring the GDPNow cast more into line with how the Bureau of Economic Analysis counts GDP, and is the more reliable figure.
[10] Source: Yale Budget Lab. Data as of April 15, 2025.
[11] Source: Bureau of Economic Analysis. Gross Domestic Product (GDP). Accessed April 3, 2025.
[12] Source: iShares. Data as of April 14, 2025.